2.2 Optical spectra
2.2.1 Normal galaxies
Normal galaxies are made up of stars and (in the case of spiral and irregular galaxies) gas and dust. Their spectra consist of the sum of the spectra of these components.
The optical spectra of normal stars are continuous spectra overlaid by absorption lines (Figure 1). There are two factors to consider when adding up the spectra of a number of stars to produce the spectrum of a galaxy:
Different types of star have different absorption lines in their spectra. When the spectra are added together, the absorption lines are 'diluted' because a line in the spectrum of one type of star may not appear in the spectra of other types.
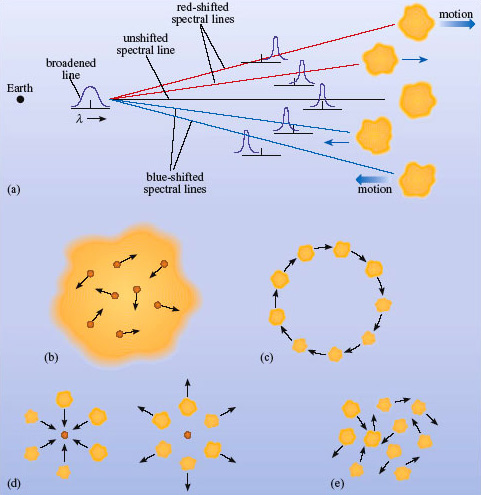
Doppler shifts can affect all spectral lines. All lines from a galaxy share the red-shift of the galaxy, but Doppler shifts can also arise from motions of objects within the galaxy. As a result, the absorption lines become broader and shallower. We explain below how this Doppler broadening comes about.
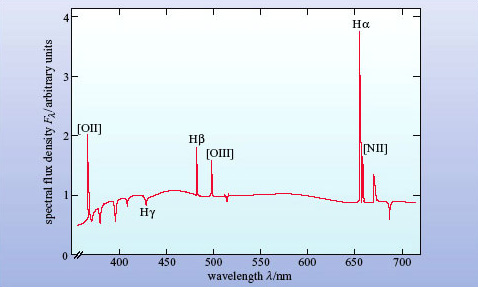
HII regions in spiral and irregular galaxies (though not, of course, ellipticals) shine brightly and contribute significantly to the spectrum of the galaxy. The optical spectrum of an HII region consists mainly of emission lines, as in Figure 2. When the spectra of the HII regions and the stars of a galaxy are added together, the emission lines from the HII regions tend to remain as prominent features in the spectrum unless a line coincides with a stellar absorption line. There are Doppler shift effects, however, as described for stellar absorption lines, and hence emission lines too are broadened because of the motion of HII regions within a galaxy.
Box 1: Doppler Broadening
The Doppler effect causes wavelengths to be lengthened when the source is moving away from the observer (red-shifted) and shortened when the source is moving towards the observer (blue-shifted).
Light from an astrophysical source is the sum of many photons emitted by individual atoms. Each of these atoms is in motion and so their photons will be seen as blue- or red-shifted according to the relative speeds of the atom and the observer. For example, even though all hydrogen atoms emit H![]() photons of precisely the same wavelength, an observer will see the photons arrive with a spread of wavelengths: the effect is to broaden the H
photons of precisely the same wavelength, an observer will see the photons arrive with a spread of wavelengths: the effect is to broaden the H![]() spectral line - called Doppler broadening.
spectral line - called Doppler broadening.
In general, if the emitting atoms are in motion with a range of speeds Δν along the line of sight to the observer (the velocity dispersion) then the Doppler broadening is given by

where c is the speed of light, and λ is the central wavelength of the spectral line.
Why would the atoms be in motion? An obvious reason is that they are 'hot'. Atoms in a hot gas, for example, will be moving randomly with a range of speeds related to the temperature of the gas. For a gas of atoms of mass m at a temperature T, the velocity dispersion is given by

where k is the Boltzmann constant (1.38 × 10⁻²³ J K−1).
Question 1
Calculate the velocity dispersion for hydrogen atoms in the solar photosphere (temperature ∼6 × 10³ K). Then work out the width in nanometres of the H![]() line (656.3 nm) due to thermal Doppler broadening.
line (656.3 nm) due to thermal Doppler broadening.
Answer
For the Sun's photosphere we have T = 6000 K and m = mH = 1.67 × 10⁻²⁷ kg.
So the velocity dispersion is given by

So hydrogen atoms in the Sun's atmosphere are moving at around 10 km s−1.
Rearranging Equation 3.1 we have

so the Doppler broadening of the solar H![]() line is 0.02 nm (to 1 significant figure). (This is a tiny broadening, about 1 part in 30 000, and rather difficult to observe.)
line is 0.02 nm (to 1 significant figure). (This is a tiny broadening, about 1 part in 30 000, and rather difficult to observe.)
It is very common for Doppler broadening to be expressed as a speed rather than Δλ or even Δλ/λ. So astronomers would say that the width of the solar H![]() line is about 10 km s−1.
line is about 10 km s−1.
You can also see that thermal Doppler broadening depends on the mass of the atom so, for the same temperature, hydrogen lines will be wider than iron lines.

Thermal motion is not the only way in which a velocity dispersion can arise. Bulk movements of material can also broaden spectral lines.
What kinds of bulk motions could give rise to Doppler broadening?
For a line to be broadened, the emitting atoms must be moving at different speeds along the line of sight. This could occur where a gas cloud is rotating, where gas is flowing inwards or outwards from a centre, or where gas is in turbulent or chaotic motion.
So a galaxy rotating about its centre will produce a spectrum in which the lines are broadened. Normal galaxies have Δν values of between 100 and 300 km s−1, which you can see is far higher than thermal motions in a hot gas such as the Sun's photosphere. Whether the bulk motion is a rotation, an infall, an outflow, or just turbulence makes no difference; the net effect will be a broadened line whose width is proportional to the range of velocities present.
How might you distinguish thermal broadening in a spectrum from broadening due to bulk motions?
Thermal broadening depends on the mass of the individual emitting atoms (heavy atoms move more slowly) so lines from different elements will have different values of Δλ/λ. Broadening from bulk motion will affect all spectral lines equally; they will have the same value of Δλ/λ.
Doppler broadening applies equally to emission and absorption lines. The broadening is due to the motion of the emitting or absorbing atoms (Figure 3).
Question 2
Our Galaxy rotates at between roughly 200 and 250 km s−1. Estimate the broadening of lines if it were observed edge-on by an astronomer situated in a distant cluster of galaxies. (Assume that our Galaxy is not spatially resolved in such observations.)
Answer
Edge-on, this is the approach speed at one extremity and the recession speed at the other. So the line-width that would be observed if the Galaxy were viewed edge-on is 400-500 km s−1.
One more feature of emission lines from HII regions needs to be mentioned, and that is the presence of so-called forbidden lines, as opposed to the others, which are called permitted lines. The term 'forbidden line' arose from quantum theory. The permitted lines all obey a certain set of rules in that theory, whereas the forbidden lines break these rules. Most spectral lines that are seen astronomically can be produced in regions of either high or low gas density. Forbidden lines are produced only in regions of very low density; this is because the excited states responsible for their production are so long-lived that, at higher densities, the atom or ion is likely to be de-excited by collision with another particle before a photon can be emitted spontaneously. Such low densities cannot be achieved on Earth which is why these lines are not observed in the laboratory. When they are observed astronomically, we can be sure that they have been produced in a region of extremely low density. They are prominent in the spectra of active galaxies and are denoted by square brackets [ ]. Strong forbidden lines seen in HII regions include [NII] at 655nm and [OIII] at 501 nm (see Figure 2).
So what will the spectrum from a normal galaxy look like? It depends what kind of galaxy it is. The optical spectrum of an elliptical galaxy is a continuous spectrum with absorption lines. Sensitive observations of elliptical galaxies typically reveal the presence of many absorption lines, although these lines are somewhat broader and shallower than those seen in individual stellar spectra. There are no emission lines, because elliptical galaxies have no HII regions. The overall shape of the spectrum looks like that of a K-type (fairly cool) star because cool giant stars dominate the luminous output of the galaxy.

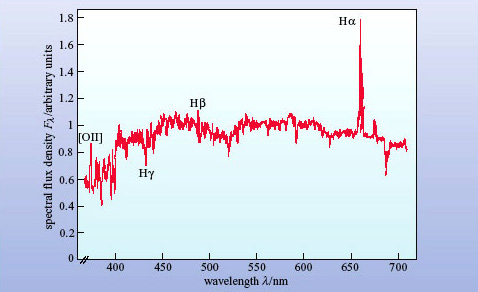
The optical spectrum of a spiral galaxy consists of the continuous spectrum from starlight with a few shallow absorption lines from stars, plus a few rather weak emission lines from the HII regions. Figure 4 shows an example. Note that the H![]() line in this spectrum is a result of both absorption from stars and emission from HII regions.
line in this spectrum is a result of both absorption from stars and emission from HII regions.
Why has there been no mention of dust so far?
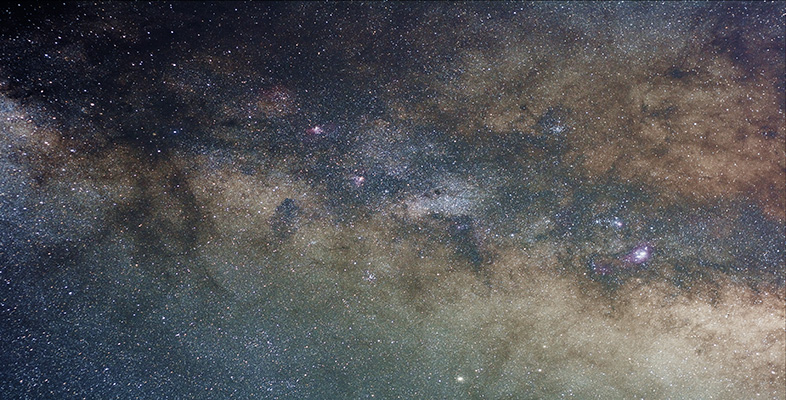
Because we are only discussing optical spectra. Other than dimming the starlight, dust has no emission or absorption lines in the optical region.
Before moving on to consider the spectrum of active galaxies, look at the spectrum in Figure 5.

How does the spectrum of the mystery galaxy in Figure 5 compare with those in Figure 2 and Figure 4? How would you interpret the difference?
The spectrum in Figure 5 shows very strong emission lines, similar to the spectrum of an HII region in Figure 2. Although the stellar absorption spectrum is present, the line spectrum is dominated by HII regions rather than stars. It looks like a galaxy with more HII regions than normal.
In fact, Figure 5 is the spectrum of a starburst galaxy. Starburst galaxies are otherwise normal galaxies that are undergoing an intense episode of star formation. They contain many HII regions illuminated by hot, young stars, and the emission lines show up clearly in the optical spectrum. We mention starburst galaxies here because, as you will see, their spectra have a resemblance to active galaxies, and it is important to be able to distinguish them.
