

Normal galaxies
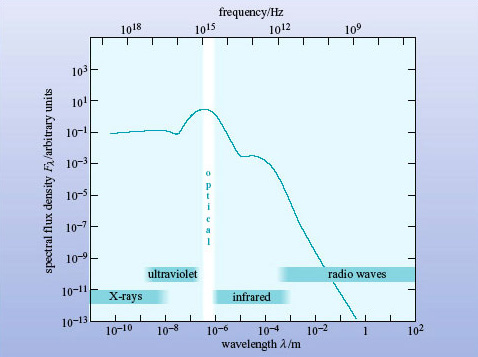
Figure 8 shows schematically the broadband spectrum of a normal spiral galaxy. It resembles that of the Sun, although the peak occurs at a slightly longer wavelength and there are relatively greater spectral flux densities at X-ray, infrared and radio wavelengths.
What are the objects in a normal galaxy that emit at (a) X-ray, (b) infrared and (c) radio wavelengths?
(a) X-rays are emitted by X-ray binary stars, supernova remnants and the hot interstellar medium.
(b) Infrared radiation comes predominantly from cool stars, dust clouds, and dust surrounding HII regions.
(c) Radio waves are emitted by supernova remnants, atomic hydrogen and molecules such as CO.
From Figure 8 you would conclude that the spectrum peaks in the optical, but there is a subtlety in the definition of Fλ which needs to be addressed.
Look again at the broadband spectrum in Figure 8. Is this galaxy brighter in X-rays or in the far-infrared (λ ∼ 100 μm)?
The Fλ curve is higher in the X-ray region, so the galaxy appears to be brighter in X-rays than in the far-infrared (far-IR).
Obvious, isn't it? Well, appearances can be misleading. The spectral flux density Fλ is defined as the flux density received over a 1-μm bandwidth (see Box 2). At far-IR and radio wavelengths that bandwidth is a tiny fraction of the spectrum. But at shorter wavelengths, 1 μm covers the entire X-ray, UV and visible regions of the spectrum! So Fλ will underestimate the energy emitted by a galaxy in the far-IR (and radio wavelengths) and exaggerate the energy emitted in X-rays.
To correct this bias in Fλ spectra, astronomers often plot the quantity λFλ instead. λFλ, pronounced 'lambda eff lambda', (with units of W m−2) is a useful quantity when we are comparing widely separated parts of a broadband spectrum. If the spectrum in its normal form of Fλ against λ is replotted in the form of λFλ against λ, (still on logarithmic axes) then the highest points of λFλ will indicate the wavelength regions of maximum power received from the source.
A broadband spectrum plotted in this way is known as a spectral energy distribution (or SED) because the height of the curve is a measure of the energy emitted at each point in the spectrum.
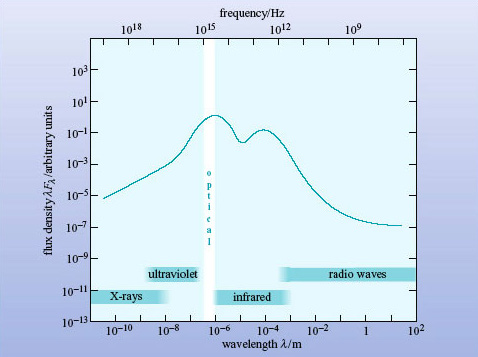
In Figure 9, λFλ has been plotted against λ for the normal galaxy spectrum of Figure 8, and it can be clearly seen that this curve has a peak at optical wavelengths, confirming what was suspected. But it also shows that more energy is being radiated at far-IR wavelengths than in X-rays, the opposite of the impression given by Figure 8. From now on in this course broadband spectra will be plotted as SEDs with λFλ against λ on logarithmic axes.
You may have found the concept of λFλ difficult to grasp. If so, don't worry about the justification, but just accept that a λFλ plot allows you to compare widely differing wavelengths fairly, whereas a conventional Fλ plot does not.
Box 2: Flux Units
Astronomers use several different units to measure the electromagnetic radiation received from an object.
Flux density, F, is the power received per square metre of telescope collecting area. It is measured in watts per square metre, W m−2.
Spectral flux density is the flux density measured in a small range of bandwidth. As bandwidth can be expressed either in terms of wavelength (λ) or frequency (ν) there are two kinds of spectral flux density in common use.
Fλ is measured in watts per square metre per micrometre (W m−2 μm−1) and Fv is measured in watts per square metre per hertz (W m−2 Hz−1). The former is preferred by optical and infrared astronomers (who work in wavelengths) and the latter by radio astronomers (who work in frequencies). The special course, the jansky (Jy), is given to a spectral flux density of 10−26 W m−2 Hz−1, in honour of the US engineer Karl Jansky (1905-1950) who made pioneering observations of the radio sky in the early 1930s.
Both flux density and spectral flux density are commonly (though inaccurately) referred to as flux.
Note that the symbol ν (Greek letter 'nu') is commonly used to denote the frequency of electromagnetic radiation. In this course, the convention is to use f to denote frequency.
Question 4
Astronomers observe two galaxies at the same distance. Both have broad, smooth spectra.
Galaxy A is seen at optical wavelengths (around 500 nm), and yields a spectral flux density Fλ = 10−29 W m−2 μm−1; it is not detected in the far infrared at around 100 μm (the upper limit to the measured flux density is Fλ −32 W m−2 μm−1).
Galaxy B appears fainter in the optical and gives Fλ = 10−30 W m−2 μm−1 around 500 nm, and the same value at around 100 μm.
Which (on these data) is the more luminous galaxy?
Answer
In the optical region (λ = 0.5 μm) galaxy A has λFλ = 0.5 × 10⁻²⁹ W m−2.
For galaxy B, λFλ = 0.5 × 10⁻³⁰ W m−2.
So galaxy A is 10 times brighter in the optical.
In the far-infrared (λ = 100 μm), the upper limit to λFλ is 10−30 W m−2 whereas galaxy B has λFλ = 10−28 W m−2. The far-infrared flux density of galaxy B is not only greater than that of galaxy A at this wavelength, but also exceeds the flux density at optical wavelengths of both galaxies. On the basis of these (very sparse!) data, it is concluded that galaxy B is the more luminous galaxy.