

2.3 Electromagnetic radiation
To help explain the nature of the waves of energy known as electromagnetic radiation, visualise a pond into which a stone has been thrown. If the state of the pond is 'frozen' at an instant in time, the height or depth of the water's surface at that moment will vary with distance from the source of the disturbance. If you were to cut a slice through the pond, you would see a wave shape similar to Figure 3
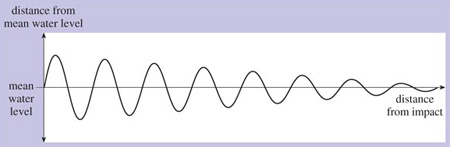
The left-hand side is the point where the stone entered the water and the right-hand side is the point where the ripples have died away.
In this example, the magnitude of the peaks and troughs of the wave decreases as we move away from the disturbance and the energy is dissipated. We can say that the wave decays. If the energy wasn't dissipated and there was no decay, the shape would be as shown in Figure 4. Waveforms with a periodically repeating curve of this general shape are known as sinewaves.
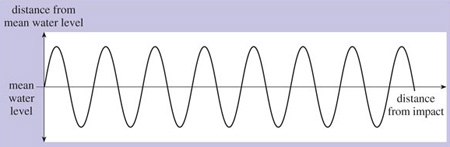
Electromagnetic waves are also sinusoidal (that is, having the shape of a sine wave). If we could freeze an electromagnetic wave at an instant in time, measure its electric or magnetic field strength at different points in space, and plot these measurements on a graph, the shape of the graph would be similar to Figure 4. But it's more usual to measure the strength of its electric or magnetic field at different instants in time as it travels through a single point in space. If we were to do this, measuring the field strength at regular intervals – say every millisecond (one-thousandth of a second) – and plot the results on a graph, it would resemble Figure 5. The wave oscillates regularly and repeatedly with time around its mean value. A single full oscillation is known as a wave cycle.
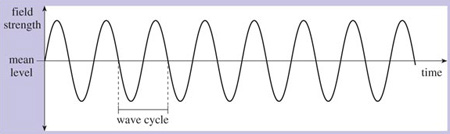
The frequency of the wave is the number of wave cycles it completes in a single second. The unit for measuring frequency is the Hertz (Hz). For example, a wave that completes one wave cycle every second has a frequency of 1 Hz; a wave that completes 1000 wave cycles every second has a frequency of 1000 Hz or 1 kHz. Higher frequencies can be expressed in terms of MHz (megahertz – 1 000 000 cycles per second) or GHz (gigahertz – 1 000 000 000 cycles per second).
Electromagnetic waves are characterised by their wave frequency. We've already mentioned light waves and radio waves, which are examples of electromagnetic radiation. Other examples are ultraviolet and infrared rays, gamma rays, X-rays and microwaves. These are all names given to groups of electromagnetic waves that behave in a similar manner to each other. Each group occupies a particular space, determined by its range of frequencies, in the electromagnetic spectrum. The term electromagnetic spectrum refers to the entire range of frequencies of electromagnetic waves. This is shown in Figure 6.
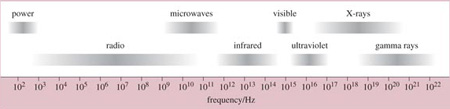
In this figure, the frequency scale is shown in Hertz along the bottom. Notice how the frequencies are expressed – for example, 102, 103, 104, etc. This is a kind of shorthand method – known as scientific notation – of expressing large numbers, which we will discuss in the next section. Notice also how the lines representing a particular group of waves are smudged at either end: this is because there are no clear start and end points to the named groups. For example, X-rays are shown to occupy a portion of the electromagnetic spectrum between about 1017 Hz and 1020 Hz, but at the lower end they blur into ultraviolet waves and at the upper end into gamma rays.