

1 Scale diagrams
1.1 Understanding scale diagrams
Plans of houses and instructions for assembling shelves, etc., often come in the form of scale diagrams. Each length on the diagram represents a length relating to the real house, the real shelves, etc. Often a scale is given on the diagram so that you can see which length on the diagram represents a standard length, such as a metre, on the real object. This length always represents the same standard length, wherever it is on the diagram and in whatever direction.
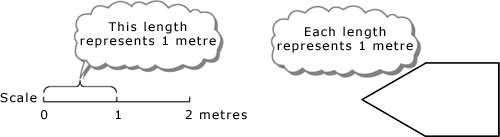
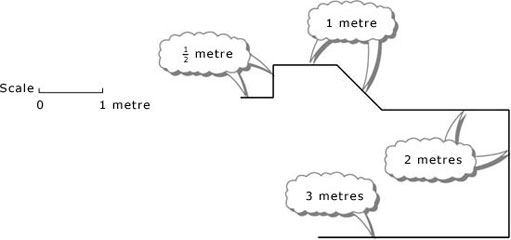
Other lengths may represent fractions or multiples of this standard length. Thus, lengths which are half as long on the diagram represent lengths which are half as long in reality; lengths which are twice as long on the diagram represent lengths which are twice as long in reality; and so on.
Scale diagrams are often drawn on a square grid. It is then possible to count squares on the grid rather than measure lengths on the diagram. Care must be taken with either method: the ends of a length may fall between the marks on the ruler, or the grid lines may not be equally spaced.
Example 1
Below is a scale plan of a bathroom. Answer the questions listed below the plan. You might want to show the ruler and then drag it to make your measurements.
The background squares show the length representing 1 m.
Click on 'Reveal answer' for a detailed solution.
Answer
On the plan, the top and bottom walls are 3 squares wide, and so the bathroom is 3 m wide. The side walls in the diagram are 3 and a bit squares long. If you measure the ‘bit’, you will find that it is one-fifth of the length representing 1 m, and therefore it represents ![]() or 0.2 m. It follows that the total length of each side wall is 3.2 m. Hence the bathroom measures 3 m by 3.2 m.
or 0.2 m. It follows that the total length of each side wall is 3.2 m. Hence the bathroom measures 3 m by 3.2 m.
The shower in the plan is 1 square in each direction, so in reality it is 1 m by 1 m.
The bath in the plan is nearly 2 squares long. If you measure it on the plan, you will find it is 1 square plus ![]() (or 0.8) of a square long. It is also
(or 0.8) of a square long. It is also ![]() or 0.8 of a square wide on the plan. This means that in reality its dimensions are 1.8 m by 0.8 m.
or 0.8 of a square wide on the plan. This means that in reality its dimensions are 1.8 m by 0.8 m.
As the doorframe is about 1 square wide on the plan, the actual door is about 1 m wide.
Example 2
(a) The scale on a diagram is such that 2 cm represent 1 m. What lengths do 6 cm, 0.2 cm, 3 cm, 3.6 cm and 0.5 cm represent?
(b) A window is 2.3 m wide and 1.4 m high. Draw a scale diagram of the window, using a scale in which 2 cm represent 1 m.
Answer
(a) Because you are being asked to convert lengths on the diagram into real lengths, it is easiest to work with a diagram length of 1 cm. As 2 cm represent 1 m, 1 cm will represent 0.5 m. Then
6 cm represent 0.5 × 6 m = 3 m,
0.2 cm represent 0.5 × 0.2 m = 0.1 m,
3 cm represent 0.5 × 3 m = 1.5 m,
3.6 cm represent 0.5 × 3.6 m = 1.8 m,
0.5 cm represent 0.5 × 0.5 m = 0.25 m.
(b) Here 1 m in reality is represented by 2 cm on the diagram. So
2.3 m are represented by 2.3 × 2 cm = 4.6 cm,
1.4 m are represented by 1.4 × 2 cm = 2.8 cm.
The rectangle should be 4.6 cm by 2.8 cm and the 1 metre scale should be represented by 2 cm.