

3.4.1 Try some yourself
Activity 22
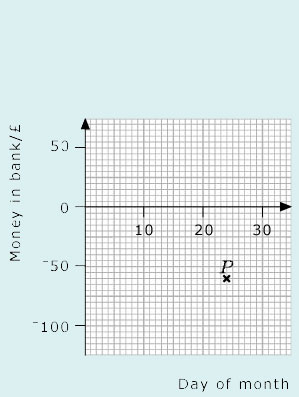
Write down the coordinates of the point P on each of the graphs below and interpret these coordinates in terms of the labels on the axes.


Answer
(a) (12.00, 30). This means that the temperature at midday was 30°C.
(b) (9.5, 10). At 9.30 a.m. the temperature was 10°C.
(c) (24, −60). On the 24th of the month there was −£60 in the bank (that is, the account was overdrawn by £60).
Activity 23
Choose the most suitable axes and plot the following sets of points:
(a) (2, 10), (4, 38), (7, 26), (5, 23);
(b) (350, 150), (420, 168), (630, 172), (570, 159);
(c) (140, 6), (−100, 30), (60, 13), (−60, 22).
Activity 24
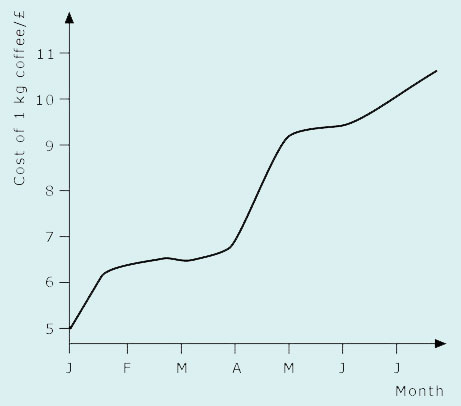
Summarise the information given by the graph below.
Answer
The cost of coffee increased over the period from £5 per kilogram to over £10 per kilogram. It remained more or less steady between February and April, rose significantly during the month of April, then increased slowly but steadily until July.
Activity 25
Draw a graph on graph paper based on the data in this table. What shape is your graph?
Click on the link below for a graph paper PDF to print and use.
Graph Paper [Tip: hold Ctrl and click a link to open it in a new tab. (Hide tip)]
| Length of bus journey/km | 0.5 | 1 | 1.5 | 2 | 2.5 | 3 | 3.5 | 4 |
| Cost/£ | 1.20 | 1.28 | 1.32 | 1.42 | 1.50 | 1.62 | 1.69 | 1.86 |
Answer
Again, the size of the graph paper and the scales used will have an effect, but your graph should resemble the one below. The graph is approximately a straight line.
