

3.1 Pie charts: surgical removal of tattoos
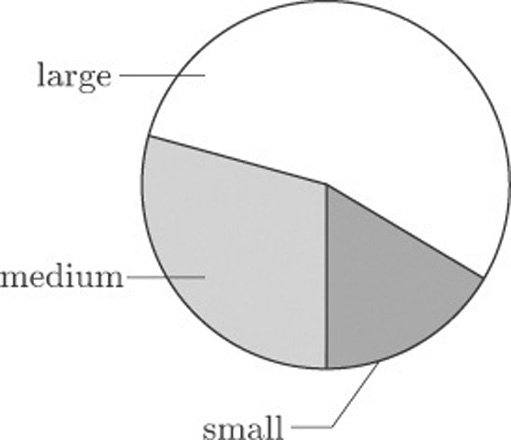
Suppose we count the numbers of large, medium and small tattoos from the data in Table 7: there were 30 large tattoos, 16 of medium size and 9 small tattoos. These data are represented in Figure 1. This display is called a pie chart.
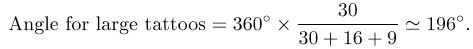
This is an easy display to construct because the size of each ‘slice’ is proportional to the angle it subtends at the centre, which in turn is proportional to the count in each category. So, to construct Figure 1, you simply draw a circle and draw in radii making angles that represent the counts of large, medium and small tattoos respectively. For example, you can calculate the angle that represents the number of large tattoos as follows.
Activity 3: Tattoo sizes
Calculate the angles that represent the numbers of medium and small tattoos.
Answer
Solution
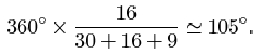
The angle for medium tattoos is
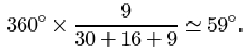
The angle for small tattoos is
Once you have calculated the angles, you draw in the three radii that subtend them, and then shade the three sectors in order to distinguish them from each other.
At first sight the pie chart seems to fulfil the basic requirements of a good statistical display: it appears to be informative, easy to construct, visually appealing and readily assimilated by a non-expert.
Pie charts can be useful when all you want the reader to notice is that there were more large than medium size tattoos, and more medium than small tattoos. But in conveying a good impression of the relative magnitudes of the differences, they have some limitations. Also pie charts are useful only for displaying a limited number of categories, as the next section illustrates.