

3.7 Problems with graphics: nuclear power stations
Figure 8 shows a pie chart of the data on nuclear power stations from Table 1. This diagram is similar to Figure 2, except that the data for all countries apart from the five with the largest numbers of power stations have been amalgamated into a single ‘Others’ category.
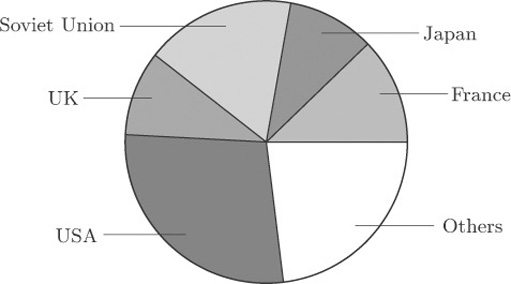
Figure 9 shows two attempts to display the same information in a ‘three-dimensional’ form. Can you see how they differ from one another?
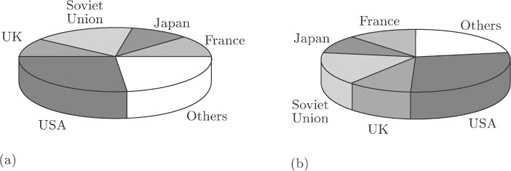
The only difference is the location of the ‘slices’. In Figure 9(b) they have been turned round through an angle of 90 degrees, compared to Figure 9(a). Yet this changes the whole appearance of the diagram. For instance, at first glance the UK ‘slice’ looks rather bigger in Figure 9(b) than that in Figure 9(a), and the Soviet Union ‘slice’ looks bigger in Figure 9(a) than that in Figure 9(b). In both cases, the differences are apparent rather than real, and are due to the angles at which the ‘slices’ are being viewed. To make comparisons between the sizes of different categories is not as straightforward as it might be even in Figure 8, because the human perception system finds it harder, on the whole, to compare angles than to compare lengths (as in a bar chart). But when you look at Figure 9(a), or Figure 9(b), you are being asked to make comparisons in a representation, on two-dimensional paper, of angles at an oblique direction to the direction in which you are looking. It is a tribute to the robustness of the human perception system that we can do this at all; but it is far from easy to do it accurately. ‘Three-dimensional’ charts might superficially look nicer, but they can be seriously misleading.