

5.3 The mean
The second measure of location defined in this course for a collection of data is the mean. Again, to be precise, we are discussing the sample mean, as opposed to the population mean. This is what most individuals would understand by the word ‘average’. All the items in the data set are added together, giving the sample total. This total is divided by the number of items (the sample size).
The sample mean
The mean of a sample is the arithmetic average of the data values. It is obtained by adding together all of the data values and dividing this total by the number of items in the sample.
If the n items in a data set are denoted x 1, x 2,…, xn , then the sample size is n, and the sample mean, which is denoted ![]() , is given by
, is given by
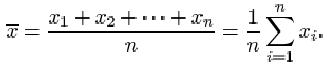
The symbol ![]() denoting the sample mean is read ‘x-bar’.
denoting the sample mean is read ‘x-bar’.
Recall that the symbol for the Greek upper-case letter sigma Σ is used to mean ‘the sum of’. The expression
which reads ‘sigma i equals 1 to n’, means the sum of the terms x 1, x 2,…, x n .
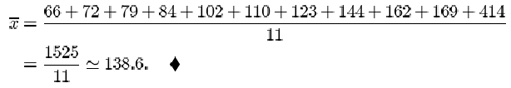
From the data in Table 4 (repeated at the start of section 4.2), the mean β endorphin concentration (in pmol/l) of collapsed runners is
Activity 9: Beta endorphin concentration (successful runners)
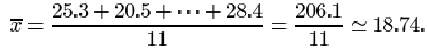
Find the mean of the ‘After – Before’ differences given in Table 10.
Answer
Solution
The mean ‘After – Before’ difference (in pmol/l) is
Two plausible measures of location have been defined for describing a typical or representative value for a sample of data. Which measure should be chosen in a statement of that typical value? In the examples we have looked at in this section, there has been little to choose between the two. Are there principles that should be followed? As you might expect there are no hard and fast rules: it all depends on the data that we are trying to summarise, and our aim in summarising them.
To a large extent deciding between using the sample mean and the sample median depends on how the data are distributed. If their distribution appears to be regular and concentrated in the middle of their range, the mean is usually used. When a computer is not available, the mean is easier to calculate than the median because no sorting is involved and, as you will see later in the course, it is easier to use for drawing inferences about the population from which the sample has been taken.
If, however, the data are irregularly distributed with apparent outliers present, then the sample median is often preferred in quoting a typical value, since it is less sensitive to such irregularities. You can see this by looking again at the data on collapsed runners in Table 4. The mean endorphin concentration is 138.6 pmol/l, whereas the median concentration is 110. The large discrepancy is due to the outlier with an endorphin concentration of 414. Excluding this outlier brings the mean down to 111.1 while the median decreases to 106. From this we see that the median is more stable than the mean in the sense that outliers exert less influence upon it. The word resistant is sometimes used to describe measures which are insensitive to outliers. The median is said to be a resistant measure, whereas the mean is not resistant.
A general comment on the use of certain familiar words in statistics is appropriate here. Notice the use of the word ‘range’ in the second paragraph after Activity 9. The statement made there is a statement of the extent of the values observed in a sample, as in ‘the observed weights ranged from a minimum of 1.03kg to a maximum of 3.64kg’. It need not be an exact statement: ‘the range of observed weights was from 1kg to about 4 kg’. However, in Subsection 4.6 you will see the word ‘range’ used in a technical sense, as a measure of dispersion in data. This often happens in statistics: a familiar word is given a technical meaning. Terms you will come across later in the course include expectation, likelihood, confidence, estimator, significant. But we would not wish this to preclude normal English usage of such words. It will usually be clear from the context when the technical sense is intended.