

5.4.2 Waiting times between geyser eruptions
Figure 20 shows a histogram of waiting times, varying from about 40 minutes to about 110 minutes.
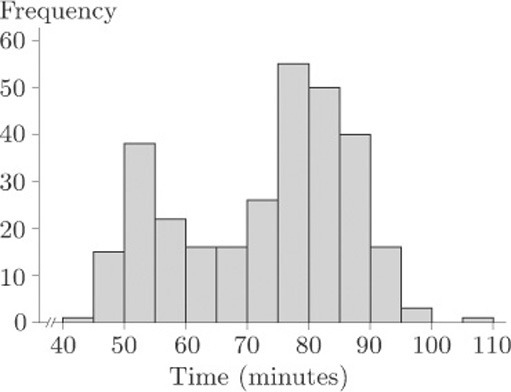
In fact, these are waiting times between the starts of successive eruptions of the Old Faithful geyser in the Yellowstone National Park, Wyoming, USA, during August, 1985. Observe the two modes. These data are said to be bimodal.
Sometimes data sets may exhibit three modes (trimodal) or many modes (multimodal). You should be wary of too precise a description. Both the data sets in Figures 19 and 20 were based on large samples, and their message is unambiguous. As you will see later in the course, smaller data sets can give rise to very jagged histograms indeed, and any message about one or more preferred observations is consequently very unclear.