

1.3.3 Drawing a pie chart
You can use the fact that the sum of angles at a point is 360° to draw a pie chart.
Example 4
Over a five-year period a mathematics tutor found that 16 of her students gained distinctions, 32 gained pass grades and 12 failed to complete the course. Draw a pie chart to represent these data.
Answer
First, calculate how many students there were altogether:
16 + 32 + 12 = 60 students.
The whole pie chart (360°) must, therefore, represent 60 students. This means that each student is represented by 360° ÷ 60 = 6°. So the angles for the three slices are
| distinctions | 16 × 6 = 96° |
| pass grades | 32 × 6 = 192° |
| failed to complete | 12 × 6 = 72° |
The pie chart can be constructed by carefully measuring these angles at the centre of a circle. The slices should be labelled, and an appropriate title given to the chart. The source of the data should also be stated.
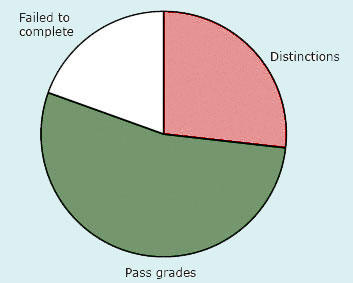
Pie chart showing results of 60 mathematics students over a five-year period (Source: Tutor's own records)