
3.3 HIV testing in sub-Saharan Africa
Example 3.2 HIV testing in sub-Saharan Africa
In developed countries, the standard method for testing whether a person is infected with the virus HIV, that causes AIDS, is to carry out a blood test. Provided such a test is carried out long enough after the initial infection occurred, the accuracy is high. However, in sub-Saharan Africa, where in most countries the incidence of AIDS is much higher than in the developed world, blood testing can be difficult to conduct and it is expensive in terms of the health resources available. Thus there is interest in whether HIV infection can be diagnosed at all reliably on the basis of clinical features that are more easily measured or observed under the local circumstances. People infected with HIV often have enlarged lymph nodes, and these enlarged nodes can be felt from the outside of the body in a simple physical examination. However, there are very many other reasons as well as HIV infection for an individual to have enlarged lymph nodes. (In countries like the UK, the overwhelming majority of enlarged lymph nodes are caused by infections that have nothing whatever to do with HIV or AIDS.)
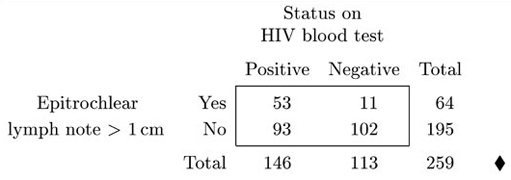
To investigate whether enlarged lymph nodes could play a role in testing for HIV in an African context, researchers in Zimbabwe investigated all adult patients admitted to an acute medical ward in a Harare hospital over a three-month period (apart from one patient who did not agree to take part). Each patient was tested for HIV using a standard (and an accurate) blood-testing method. (In fact, 56% of the patients turned out to have an HIV infection according to these tests.) In addition, the patients were examined (by feeling) for enlarged lymph nodes in three areas of their body. The data in Table 3.4 provide information on the numbers of patients who had an epitrochlear lymph node (a node in the upper arm near the elbow) swollen to a size larger than 1 cm.
Activity 10 HIV testing: calculating proportions
(a) Suppose you were a doctor practising in a hospital in sub-Saharan Africa, in a place where the general characteristics of patients that you see is likely to be reasonably similar to those reported on in Table 3.4. You decide to investigate for enlarged epitrochlear lymph nodes in the patients you see and, depending on whether you find such a node enlarged to over 1 cm, to use this information together with that in Table 3.4 to take a view on how likely it is that the patient has HIV. Would it help you more to recalculate the numbers in the main body of Table 3.4 as percentages of the row totals or the column totals? Calculate the set of percentages you believe to be more appropriate. In the light of your results, what would be your view on how likely it is that patient with an epitrochlear node over 1 cm actually has HIV (according to blood test). What about a patient who does not have such a node?
(b) Suppose now that you are a scientific researcher interested in the physiological mechanism by which HIV infection can cause enlarged lymph nodes. In investigating this topic, would it help you more to recalculate the numbers in the main body of Table 3.4 as percentages of the row totals or the column totals? Calculate the set of percentages you believe to be more appropriate and comment on what you find.
Answer
(a) In this situation, suppose one of your patients has an epitrochlear lymph node enlarged to more than 1 cm. You might then want to ask ‘What proportion of such patients actually have HIV (as would show up if they were given a standard blood test)?’ That is, you know your patient corresponds to those in the first row of Table 3.4. If your patients are generally comparable to those in the Harare hospital, the proportion can be estimated by calculating the number in the first row of Table 3.4 as a percentage of the row total. For this reason, calculating the figures in the table as percentages of the row totals is helpful, and the percentages of the column totals are less relevant. Calculating all the figures as percentages of the row totals leads to Table 3.5. (The percentages have been rounded to whole numbers.)
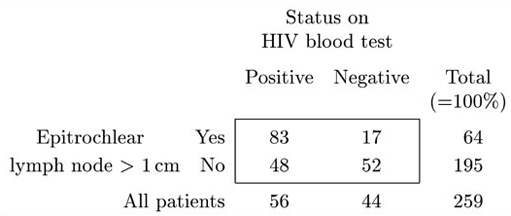
This table shows that 83% of the patients who had an enlarged epitrochlear lymph node of size over 1cm were actually infected with HIV (according to the blood test). In this context, it is quite likely that a patient with such an enlarged node will have HIV. (But bear in mind that these figures will not apply in other contexts. As Table 3.5 again makes clear (in the bottom line), 56% of all the patients in the study were HIV positive on the blood test. In a hospital in, say, Europe, this will not be the case, and it is much more likely that an enlarged epitrochlear lymph node would have some other explanation.)
The table also shows that 52% of the patients who do not have an enlarged epitrochlear lymph node of this size were not HIV positive. In the Harare context, not having this particular physical sign does not actually say much about the patient's chances of being free from HIV. The chance is rather more than would be the case for patients in general, but not much more.
(b) In this case the scientist will probably be more interested to ask ‘Of the patients who actually are HIV positive on the blood test, what proportion show an enlarged epitrochlear lymph node of this size?’. That is, the scientist would be interested in knowing how large the numbers in the table were in relation to the column totals rather than the row totals. The resulting percentages are shown in Table 3.6.
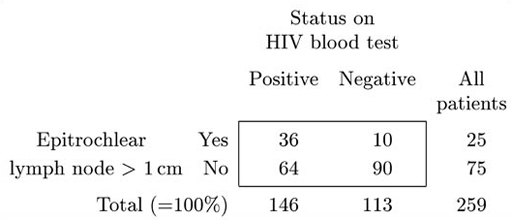
This table shows that, of the Harare patients who are HIV positive (on the blood test), 36% have this type of enlarged lymph node (so most of them do not have it). However, the fact that the presence of an enlarged lymph node of this type does have some diagnostic value is shown by the fact that a much smaller proportion, just 10%, of HIV negative patients show this particular sign.
It is worth noting that the percentages in Table 3.5 are considerably different from those in Table 3.6. Thus if you were interested in the scientist's question but calculated, mistakenly, the percentages relevant to the doctor (that is, the row percentages), you could be seriously misled.
For the data in Table 3.4, both the row percentages and the column percentages turned out to be useful quantities to calculate; but which is more useful depends on the question you are trying to answer. It is crucial not to use the row percentages to answer questions that relate to the column percentages, or vice versa. As you saw in Activity 10, the two sets of percentages can be considerably different. In general, in making calculations from data in tables, it is always important to think through carefully exactly what you want to know.
Before the final activity, some threads relating to graphics will be drawn together. You have now met several different graphics: pie charts, bar charts, histograms, scatterplots, boxplots and line plots of time series. You have seen that different types of plot are suitable for different types of data. You have also seen that the choice of an appropriate graph for presenting and examining data can depend on the question of interest. The following guidelines draw together what you have learned so far.