

3.5 The British Crime Survey
| 1997 Police | 1997 BCS | % BCS reported | % recorded of reported | % recorded of all BCS | % change 1995 to 1997 | % change 1981 to 1997 | |||
|---|---|---|---|---|---|---|---|---|---|
| Police | BCS | Police | BCS | ||||||
| Vandalism | 443 | 2917 | 26 | 58 | 15 | −4 | −15 | 121 | 7 |
| All comparable property theft (acquisitive crime) | 1751 | 6261 | 50 | 56 | 28 | −17 | −15 | 51 | 99 |
| Burglary | 519 | 1639 | 64 | 49 | 32 | −19 | −7 | 48 | 119 |
| Attempts & no loss | 140 | 976 | 50 | 29 | 14 | −17 | −0.1 | 90 | 160 |
| With loss | 379 | 664 | 85 | 67 | 57 | −20 | −15 | 37 | 77 |
| All vehicle thefts | 1022 | 3483 | 47 | 62 | 29 | −15 | −19 | 57 | 99 |
| Theft from vehicle | 552 | 2164 | 43 | 59 | 25 | −16 | −14 | 63 | 68 |
| Theft of vehicle | 316 | 375 | 97 | 87 | 84 | −21 | −25 | 10 | 31 |
| Attempted thefts | 154 | 943 | 37 | 44 | 16 | 3 | −27 | 447 | 425 |
| Bicycle theft | 151 | 549 | 64 | 43 | 27 | −18 | −17 | 19 | 154 |
| Theft from the person | 60 | 590 | 35 | 29 | 10 | −4 | −12 | 71 | 36 |
| All comparable violence | 256 | 1022 | 49 | 51 | 25 | 11 | −13 | 150 | 53 |
| Wounding | 205 | 714 | 45 | 63 | 29 | 18 | −17 | 143 | 41 |
| Robbery | 52 | 307 | 57 | 30 | 17 | −11 | −2 | 183 | 89 |
| All comparable | 2450 | 10199 | 44 | 54 | 24 | −12 | −15 | 67 | 56 |
Activity 11 The British Crime Survey
The British Crime Survey (BCS) is a sample survey carried out in England and Wales by the Home Office. The survey was first carried out in 1982, and at the time of writing (2001) is done every two years. The aim is to measure the level of crimes against people in private households. Data are collected by interviewing adult respondents from a representative sample of households about their experience as victims of crime in the previous year, and about some other matters connected with crime. For the 1998 BCS, a respondent from each of approximately 15 000 households was interviewed.
Apart from the BCS, the main source of data on crime in England and Wales is police records. Data on crimes from police records are not entirely comparable with those from the BCS, mainly because certain categories of crime are not covered by both sources of data. (For instance, frauds against companies are not recorded in the BCS because there is no personal victim in a private household.) However, there is a large set of categories of crime for which BCS data and police records should (in principle at least) be comparable. Table 3.5 is taken from the report on the 1998 BCS (and hence relates to crimes in 1997), and it compares in various ways the numbers (in thousands) of crimes (in these comparable categories) recorded by the police and measured by the BCS. (The BCS figures are estimates, based on the sample data, for total numbers of crimes in these categories in England and Wales.) In the BCS, respondents are asked, in relation to any crime of which they were a victim, whether or not it was reported to the police. Many crimes are not reported to the police, and clearly these crimes will not appear in the police records.
Some of this activity is concerned with making sense of where the figures come from in this rather complex table. In fact, rather more clues about the relationships between the different numbers are contained in the text of the report. However, with other reports and other tables, this is regrettably not always the case, so the practice you will get by working through this activity will be worthwhile!
Note also that the questions below ask you to answer briefly. Being able to make statistical points concisely in writing is an important skill generally (as well as being crucial in an examination context where time is limited).
(a) The row labelled ‘All comparable’ at the bottom of Table 3.5 concerns values for all offences in the comparable categories taken together. Explain briefly how the first three percentages in that row (44, 54, 24) relate to one another and to the first two values (2450, 10199) in the row.
(b) Consider the column labelled ‘1997 Police’. Describe briefly how values in this column are related to one another.
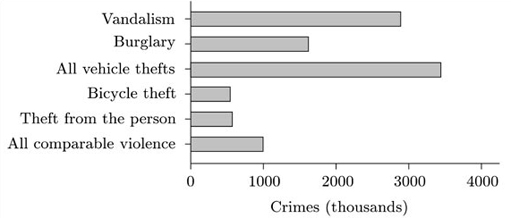
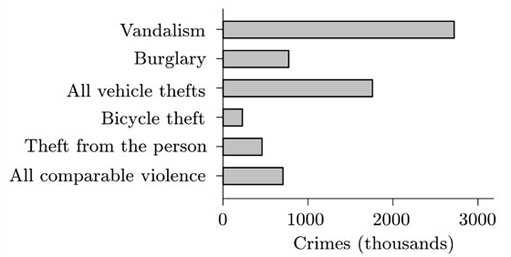
(c) Draw a suitable diagram to display the values associated with ‘Vandalism’, ‘Burglary’, ‘All vehicle thefts’, ‘Bicycle theft’, ‘Theft from the person’ and ‘All comparable violence’, using the values in the ‘1997 BCS’ column.
(d) Find and use the appropriate numbers from the table to calculate the equivalent values in 1981 to those in part (c). Draw a diagram to display these values. Using your diagrams and/or the corresponding numbers, comment briefly on the similarities and differences between the numbers of crimes in these categories in 1981 and 1997.
Answer
The questions in this activity generally required you to answer briefly. This solution is not particularly brief, because it contains material intended to explain to you what is going on. However, to clarify matters, this explanatory material is enclosed in square brackets.
(a) The value 44 [in the ‘% BCS reported’ column] is the percentage of the crimes mentioned in the BCS that, according to the BCS respondents, were reported to the police. It cannot be calculated from other values in the table. However, it can be used to deduce that the number of ‘comparable’ crimes that were reported to the police, according to BCS respondents, was 44% of 10 199 thousand, or 4488 thousand [to the nearest thousand].
The value 54 [in the ‘% recorded of reported’ column] is the percentage of the crimes that BCS respondents said were reported to the police that actually appear in the police crime statistics. It has already been calculated that 4488 thousand crimes in these categories were said by BCS respondents to have been reported to the police. According to police records, 2450 thousand such crimes were reported to them. Thus the figure of 54% is calculated as the ratio 24504488 [and indeed, allowing for some rounding error, the figures do match].
Finally, the value 24 [in the ‘% recorded of all BCS’ column] is the ratio of the total number of crimes reported to the police (according to police records) to the number of crimes recorded in the BCS. That is, it is 2450/10 199 [and again this does come to 24%].
(b) [In the ‘1997 Police’ column and, indeed, in the ‘1997 BCS’ column, the total number of comparable crimes is divided between various different categories, and some of the categories are further divided in subcategories, and in some cases these are further divided.] The value 2450 for ‘All comparable’ is the sum of the values for the categories shown in bold type, namely ‘Vandalism’, ‘All comparable property theft’ and ‘All comparable violence’. The value for ‘All comparable violence’ is approximately the sum of the values for ‘Wounding’ and ‘Robbery’. [Actually that sum is 257, not 256, but that is presumably accounted for by rounding errors, given that these values are all rounded to the nearest thousand crimes.] The value 1751 for ‘All comparable property theft’ is, within rounding error, the sum of the values for ‘Burglary’, ‘All vehicle thefts’, ‘Bicycle theft’ and ‘Theft from the person’. Finally, the values for ‘Burglary’ and for ‘All vehicle thefts’ are the sums of the values in the relevant rows given below each of these headings.
(c) [These are data in the form of counts of individual entities, in this case crimes, in a number of discrete categories. Guideline 1 for graphics suggests that there are two appropriate types of plot – a bar chart or a pie chart. Both are given here, although only one is required to answer the question. Perhaps the more appropriate is a bar chart, where the lengths of the bars indicate the numbers of crimes in each of the categories. A bar chart for the numbers of crimes in the named categories is shown in Figure 3.4.
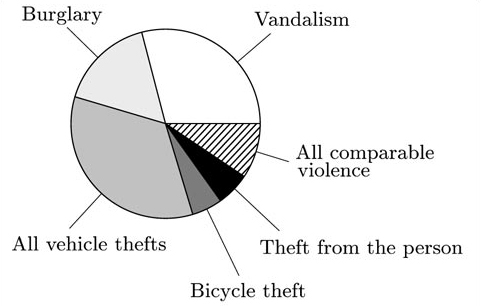
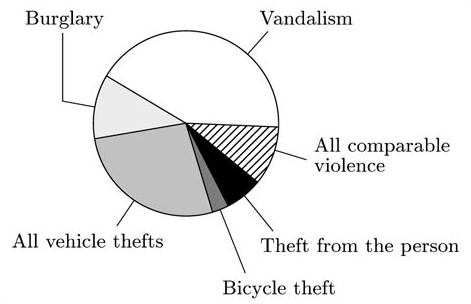
Alternatively, you may have felt that the most important point here was the way that the total number of comparable crimes was divided between these categories, in which case a pie chart might be more appropriate. However, the pie chart does not show directly the total number of crimes involved, so that a bar chart is arguably the better choice. A pie chart for the data is shown in Figure 3.5.]
(d) [Here, the relevant numbers in the table are those in the ‘1997 BCS’ column, and those in the ‘% change 1981 to 1997: BCS’ column. For the ‘Vandalism’ category, there were 2917 thousand crimes (BCS) in 1997, and the final column of the table indicates that this value is 7% higher than that for 1981. Thus the 1981 value for ‘Vandalism’ can be calculated as follows:
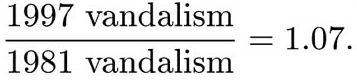
So
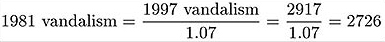
in thousands, to the nearest thousand. The other figures can be calculated in similar manner and are given below, all rounded to the nearest thousand.]
| Vandalism | [2 917/1.07=] 2726 |
| Burglary | [1639/2.19=] 748 |
| All vehicle thefts | [3 483/1.99=] 1750 |
| Bicycle theft | [549/2.54 =] 216 |
| Theft from the person | [590/1.36 =] 434 |
| All comparable violence | [1022/1.53=] 668 |
[A bar chart for these data is shown in Figure 3.6 and a pie chart in Figure 3.7. Only one of these charts is required to answer the question.]
[In fact, a better way of portraying these data, instead of either Figure 3.6 or Figure 3.7, for the purpose of the comparison you are asked to make is to plot both the 1981 and the 1997 figures on the same bar chart (guideline 2), as in Figure 3.8.]
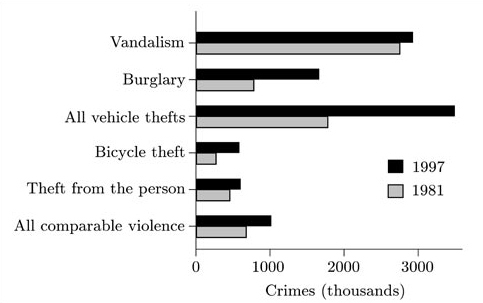
[Whichever diagram you drew, the following should be reasonably clear.] The pattern of crimes in these different categories changed considerably between 1981 and 1997. In 1981 vandalism was, by a large margin, the most common category, though the number of vehicle thefts was also large. By 1997, the numbers of crimes in all categories had increased, though the increase in the number of crimes of vandalism was relatively small. However, there had been very large increases in numbers of vehicle thefts, of bicycle thefts and of burglaries, and vehicle thefts had become the largest category. The two smallest categories in 1981 were thefts from the person and bicycle thefts, and this remained the case in 1997 even though the number of bicycle thefts had increased by over 150%.