
5 Bar charts and histograms
5.1 Bar charts
5.1.1 What is a bar chart?
A bar chart is a diagram in which the numerical values of the different variables are represented by the height or length of lines or rectangles of equal width. The bars or lines can be drawn vertically or horizontally.
Figure 4 shows three bar charts illustrating the same data: the first has vertical bars, the second horizontal bars and the third has lines instead of bars.
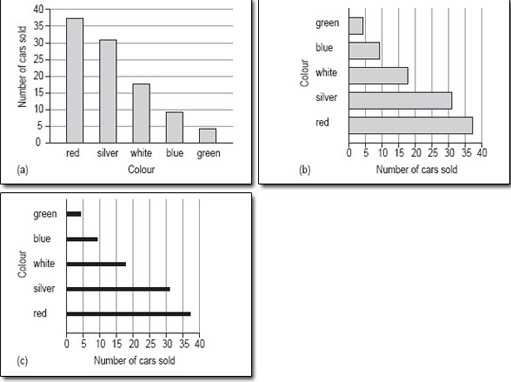
Figure 4 Popular car colours: three variations on the same bar chart