

4 Making sense of data
4.1 Reading data from tables
Tables are used as a way of describing what you are talking about in a structured format. They tend to be used to present figures, either as a summary or as a starting point for discussion. Tables are also probably the most common way of presenting data in educational courses.
Tables have always been compiled by someone. In doing so, the compiler may have selected data and they will have chosen a particular format, either of which may influence the reader. You need to be aware of the compiler of any table you are looking at. Could it be someone who is trying to tell you something in particular? For example, if a table were showing the costs of running a hospital, would you expect figures from the government or the local administrators to be more accurate? The government may be trying to make a comparison across the whole NHS, whereas local administrators may be trying to explain why they are a special case. If you consider one source to be more accurate than another, try to think of reasons why you do so. It may be due to where your sympathies lie.
Tables are a very common way of putting information across to people; so common that we probably don't notice that they are there most of the time. On the other hand, they can look quite formidable when there is a lot of information presented at once, and finding your way around them can be hard. To be easy to read, tables should have a title and sub headings. Often, there will be details of where the information in the table has come from, but this is not always the case.
Activity 3
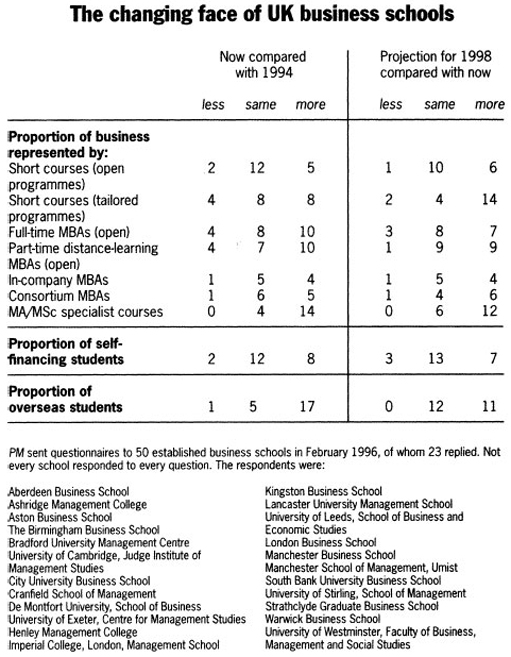
Look at the table entitled ‘The changing face of UK business schools’ and note down your answers to the following questions.
-
Where does the table come from? When was it prepared?
-
Where does the data come from? Does its source tell us anything?
-
On the left-hand side of the table is a list of headings referring to proportions. What could make this easier to follow?
Discussion
-
The table has been taken from a publication called People Management. This is the house journal for the Institute of Personnel and Development, a professional organisation that has a membership of human resources and training staff, especially in industry. It was prepared for an article in March 1996, but we can't tell from the table itself, or the explanatory notes, exactly when the data was collected.
-
The information comes from a group of 23 out of a possible 50 business schools that People Management contacted. This is only a sample of the possible business schools in the UK. People Management tells us that questionnaires were sent to established business schools, but we don't know what criteria were used to decide what is meant by ‘established’.
We have no information about how People Management chose the original sample or why only business schools in England and Scotland replied. It may be that business schools in Wales and Northern Ireland were not asked or were not interested. The Open University Business School is not mentioned here, and again we don't know why this is.
-
The headings could be expressed more clearly. Overall, the table is trying to convey two types of information. The first is about the number of business schools who run certain types of course and changes in these course-types over a four-year period. The second is about how business schools perceive changes in proportions of their business income.
The table includes the heading ‘Proportion of business represented by:’ followed by various row-heads such as ‘Consortium MBAs’. Proportion usually means a percentage (see page 13), but the figures seem to relate to the number of business schools in each category: none of the values for 1994 or 1998 add up to more than the 23 organisations that responded. Therefore, the heading should perhaps read ‘Number of business schools who think that their business incomes will increase/will not change/will decrease’.
Short courses (open programmes). Most of the respondents here, 12 out of 19 (about 63 per cent), feel their business has remained stable, 2 feel that it has decreased and 5 that it has increased since 1994. In other words, two and a half times more business schools feel that business has increased rather than decreased in this area. These courses seem to be increasing overall as a proportion of income, but not in a significant way. However, the business schools appear to be expecting more change in future, note the 6 in the last column. Looking forward, the same numbers of business schools think that the proportion will change. It depends on how you interpret these figures, though. We could say that:
-
6 times as many business schools are expecting to run more short courses than are expecting to run less such courses
or
-
one more school (6 looking forward rather than 5 looking back) has decided that they are likely to increase the proportion of students who will be represented in this category
or
-
only 6 out of 17 (about 35 per cent) could see an increase in students by 1998.
Any of these is a truthful statement, but they give very different pictures, don't they?
Short courses (tailored programmes). These are programmes made for a particular audience, mainly for a single organisation. Looking back, these seem to show a similar pattern, where twice as many business schools are looking at an increase than a decrease. This is a more changeable pattern, with only 8 out of 20 (40 per cent) of the group showing no change. Looking forward though, only 4 out of 20 (20 per cent) imagine there will be no change in tailored programmes, whereas 14 out of 20 (70 per cent) imagine that this will increase by 1998.
Note: To convert 8 out of 20 to a percentage, we carry out the division 8 ÷ 20. This equals 0.4; this is then multiplied by 100 to express it as a percentage. Expressing all the values in the table as percentages enables easier comparison. Try it yourself for the full-time MBAs in 1994. (The answers are 18 per cent, 36 per cent, and 45 per cent. This doesn't add up to 100 per cent, but to 99 per cent, so we would normally round one of the numbers up. The one that is nearest to the next whole number, is 45 per cent, so it becomes 46 per cent.) Percentages are discussed more fully in Section 4.2.
Activity 4
Now, think about the patterns shown by the proportion of overseas students. What are the perceived changes and expectations here?
Discussion
Only 5 out of the 23 business schools feel that they have the same number of overseas students as in 1994, i.e. about 22 per cent of the sample. Change has been very strongly biased towards an increase in overseas students, with 17 out of 23 (about 74 per cent) of the business schools seeing an increase over the two years. Looking forward, no business school thinks their proportion of overseas students will reduce: 12 out of the 23 (about 49 per cent) business schools don't see a change in the proportion of students in this category, and 11 out of the 23 (about 48 per cent) see a likely increase here.
Activity 5
Overall, what does the table show us about the changing face of UK business schools?
Discussion
First, it tells us absolutely nothing about the number of students involved. You will have noticed that we have been referring to proportions of students in the business schools, rather than actual numbers. That is because there is no information here. Any business school could have had a huge increase or decrease in numbers. Those who are predicting an increase could have 20 or 2000 students. We simply don't know from this table. Secondly, looking at the short courses, and our discussion above, there seems to be an increase in a perception that tailored short courses are growing as a form of business.