

4.2 Interpreting percentages
Many articles give information in the form of percentages. In such articles, tables and other numerical information are also often presented in terms of percentages. Percentages are used so often because they enable comparisons to be made more easily. Every percentage is expressing a value as a fraction (that is, as a proportion) of a hundred. ‘Percent’ is denoted by % and means ‘out of a hundred’, so 75% means 75 out of 100.
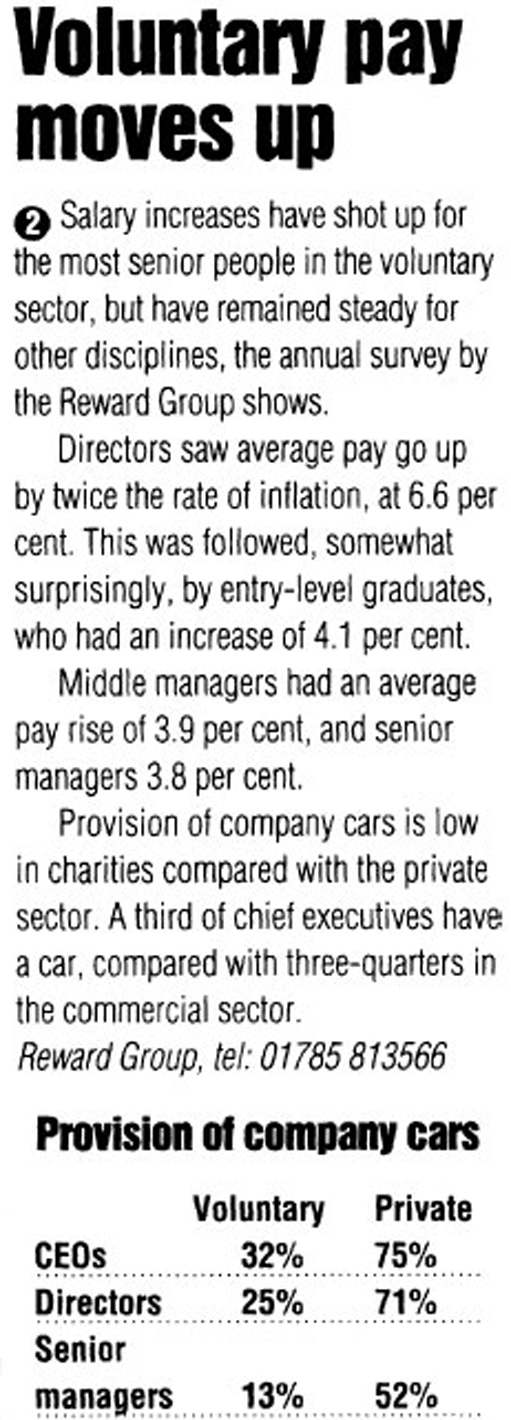
Look at the table in the article in Activity 6. It considers the provision of company cars in the private and voluntary sector. What is the percentage of Chief Executive Officers (CEOs) in the private sector with company cars?
It is 75 per cent. If we say that 75 per cent of CEOs in the private sector have company cars, we mean that 75 out of every 100 CEOs have a company car.
As a fraction, this is written as ![]() , and this is said as ‘75 over 100’ (
, and this is said as ‘75 over 100’ (![]() is the same as
is the same as ![]() ),
),
As a decimal 75 per cent is 0.75. This is said as ‘nought point seven five’ – note that each number after a decimal point is said separately, and that the leading zero (nought) is always included.
Activity 6
What can we tell about the table entitled ‘Provision of company cars’, using the questions we asked earlier and which are reproduced below the article?
-
Who wrote the article and table, and for which publication?
-
What influences has this had on the article and its conclusions?
-
Where was the data in the table derived from?
-
How does the table relate to the article?
-
What conclusions can you draw from the table and related text?
Discussion
-
The information is from Reward Group, which carriesout an annual survey in this area, but we don't know anything about the organisation; for example whether they are a government or private organisation. The article was published in Personnel Today, (a rival publication to People Management).
-
It's hard to say. However, the name Reward Group suggests a company that is interested in pay and conditions, such as employee perks. You may know of Reward Group yourself and be able to draw some extra conclusions.
-
An annual survey carried out by Reward Group. We don't know how big the sample size was; in other words, we don't know how many people were questioned.
-
It doesn't until the end; the article starts out by talking about other factors that were presumably also listed by Reward Group. The article starts by discussing salary increases, rather than company cars. This isn't unusual; articles quite often don't begin by discussing the figures in graphs and diagrams.
-
Their discussion of the data is fairly accurate, although one part could be misinterpreted. It is true to say, as they do, that (about) a third of chief executives in the voluntary sector have a car, compared with three-quarters in the private sector. However, there could be a much larger number of CEOs who have cars in the voluntary sector than in the private sector. For example, if there were 3000 CEOs in the voluntary sector who had been surveyed, then about 1000 could have a company car. If there were only 1000 surveyed in the private sector, then only 750 of them would have a company car. We don't know the size of the sample involved. It is true that this is unlikely, but it is possible.
Note: A word of warning about comparing two percentages. In the private sector, 75 per cent of the CEOs have company cars, while only 32 per cent of CEOs in the voluntary sector have them. It would be very tempting to say that the difference between the two percentages is 43 per cent (i.e. 75 per cent minus 32 per cent) and that the figure for the private sector is therefore 43 per cent bigger than that for the voluntary sector. However, because of the way percentages work, we should say that the difference between the two percentages is 43 percentage points and that the percentage for the private sector is 43 percentage points more than that for the voluntary sector. We could only say that 43 per cent more CEOs in the private than voluntary sector have company cars if we are talking about the same number of people in each group. This is a very subtle point, which is often missed by journalists in newspapers and on television and radio. See if you can spot the error next time that percentages are being discussed in the media.