

3.2 MRI: theoretical background
Consider the hydrogen nuclei in a sample in a strong magnetic field.
-
What happens to the protons in the presence of an applied magnetic field?
-
The protons align with or against an applied magnetic field (spin-up or spin-down, respectively).
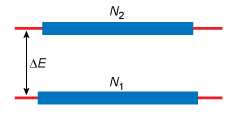
This can be represented by an energy level diagram of the form shown schematically in Figure 6. Here the lower (ground) state represents the protons aligned parallel to the field and the higher (excited) energy state represents those against the field.
-
At thermal equilibrium what is the distribution of these spins?
-
At thermal equilibrium there is an excess of spins in the lower energy level and, overall, the populations of the two energy levels are characterised by a Boltzmann distribution.
Because there are slightly more protons aligned parallel to the field (i.e. in the ground state), the tissue has an overall net magnetic moment, usually known as the net magnetisation vector in the same direction as the applied magnetic field. It is conventionally given the symbol Mz, where the subscript denotes the direction of magnetisation – in this case, parallel to the external magnetic field in the z-direction.
When a radio frequency pulse is applied, it excites some of the protons into the higher (excited) energy state. The net effect of this interaction is that the net magnetisation vector rotates away from its original direction. The angle through which it rotates is determined by the duration of the radio frequency pulse: a 90° pulse rotates the magnetisation into the xy-plane, and a 180° pulse rotates the magnetisation into the z-direction. In MRI experiments, a 90° pulse is used.
The probability of a transition from the higher energy state back to the lower level by a spontaneous process is virtually negligible (about 1 in 1018 years). It might therefore seem that net absorption due to irradiation at the resonance frequency will eventually lead to a situation in which the populations of the two energy levels become equal. Under these circumstances the NMR signal would fall to zero and the spin system would then be referred to as a saturated nuclear spin system.
-
From a practical point of view, what are the implications of the above discussion for measuring a spectrum?
-
Since the intensity of the signal is related to the population, it would suggest that if several experiments were carried out – one after another – on the NMR sample then the signal would become progressively smaller. This is because the population difference between the energy levels would decrease in each case.
However, NMR spectra can be repeatedly measured on the same sample with no obvious saturation effects. The reason for this is that there is a mechanism available for restoring thermal equilibrium in a nuclear spin system. This mechanism is called spin–lattice relaxation.
But what do we mean by the term ‘lattice’?
Lattice refers to the surroundings of a nuclear spin – both within a molecule and in the further molecular environment. In liquid samples there is fast, random motion on the molecular scale and it is possible to view this motion as constituting a reservoir of energy – furthermore, this reservoir is a very good acceptor of energy. In these terms, spin–lattice relaxation is a process that allows nuclei to transfer magnetic energy to their surroundings. In this way, the populations of the magnetic energy levels are restored to their thermal equilibrium values. Admittedly, this picture is simplified but it does provide some insight into a complex process.
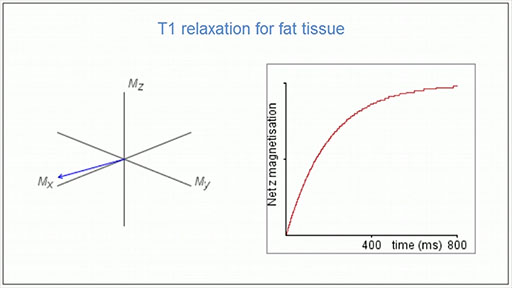
Considering again the net magnetisation vector, this will return to the z-direction through spin–lattice relaxation as shown in Video 4. This sequence starts at the point where the net magnetisation vector has been flipped into the xy-plane by an RF pulse. The component in the xy-plane reduces while the component in the z-direction recovers. The line on the graph to the right indicates the size of the z-component, Mz.
-
How does Mz change with time? What does this reflect?
-
An exponential increase in Mz is observed with time. The time taken reflects the efficiency with which the spin system can lose magnetic energy to its surroundings.
In general, spin–lattice relaxation can be viewed as the return to thermal equilibrium from saturation. The time taken reflects the efficiency with which the spin system can lose magnetic energy to its surroundings and is different for different tissues. This contributes to different contrast as you will see in Section 3.4, but first you will consider how an image is produced.