

Relaxation time
It is the relaxation characteristics that are particularly important in determining the contrast of an MR image.
There are two relaxation mechanisms for NMR transitions:
- spin–lattice relaxation time or longitudinal relaxation time (you met this briefly in Section 3)
- spin–spin relaxation time or transverse relaxation time.
You’ll now look at each one in turn.
-
What is spin–lattice relaxation?
-
Spin–lattice relaxation is a process that allows nuclei to transfer magnetic energy to their surroundings, both within a molecule and in the further molecular environment.
As you saw previously, this process is characterised by an exponential increase in the population difference between magnetic energy levels with time, as shown by the schematic diagram in Figure 9.
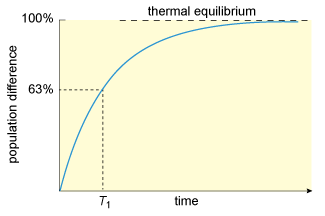
The spin-lattice relaxation time, , corresponds to the time it takes for the population difference of the magnetic energy levels to rise to a value equal to 63% of the thermal equilibrium value. The value of reflects the efficiency with which the spin system can lose magnetic energy to its surroundings. The larger the value of , the less efficient is the process, the slower the return to equilibrium and the more prone is the NMR sample to saturation.
Different tissue types have different values of . For example, cerebrospinal fluid (CSF), which is found in the brain and spinal cord has in the region of 2000 ms, whereas fat-based tissues have in the region of 200 ms. Other tissues, depending on their water content, range between these values. It follows that individual voxels in an imaging slice can have different values of depending on their content. Hence, they will be prone to saturation in different ways.
The second type of relaxation behaviour associated with an assembly of nuclear spins is transverse or spin–spin relaxation and the associated time constant is the spin–spin relaxation time, . This relates to the transfer of energy between protons in the ground state and those in the excited state.
For small molecules in solution, in a conventional NMR experiment, and are roughly equal, but protons in different tissues have different relaxation times. (Approximate values are given in Table 1.)
| Tissue | (mean)/ms | (mean)/ms |
|---|---|---|
| Fat | 250 | 80 |
| white matter | 650 | 90 |
| grey matter | 800 | 100 |
| cerebrospinal fluid (CSF) | 2000 | 150 |
| Water | 3000 | 2500 |
The reasons for the range of values shown in the table is because the protons in different types of tissue will have different degrees of freedom or mobility. This will directly affect how readily they can interact with other species in their surroundings.
-
By referring to Table 1, what can you say about the relative magnitude of and ?
-
in general tends to be much shorter than .