Exercises on Section 3
The following exercises provide extra practice on the topics covered in Section 3.
Exercise 6 Finding quartiles and the interquartile range
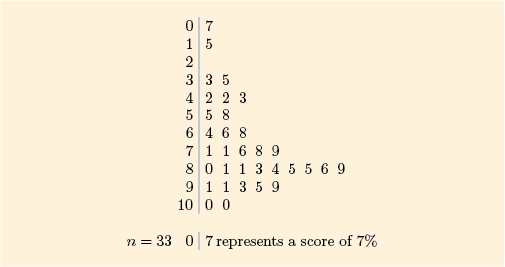
(a) For the arithmetic scores in Exercise 1 (Section 1), find the quartiles and calculate the interquartile range. The stemplot of the scores is given below.
Discussion
For the arithmetic scores, so and .
The lower quartile is therefore
The upper quartile is
The interquartile range is
(b) For the television prices in Exercise 1, find the quartiles and calculate the interquartile range. The table of prices is given below.
170 |
180 |
190 |
200 |
220 |
229 |
230 |
230 |
230 |
230 |
250 |
269 |
269 |
270 |
279 |
299 |
300 |
300 |
315 |
320 |
349 |
350 |
400 |
429 |
649 |
699 |
Discussion
For the television prices, so and .
The lower quartile is therefore
The upper quartile is
The interquartile range is
Exercise 7 Some five-figure summaries
Prepare a five-figure summary for each of the two batches from Exercise 1.
(a) For the arithmetic scores, the median is 79% (found in Exercise 1), and you found the quartiles and interquartile range in Exercise 6.
(b) For the television prices, the median is £270 (found in Exercise 1), and you found the quartiles and interquartile range in Exercise 6.
Exercise 8 Boxplots and the shape of distributions
Boxplots of the two batches used in Exercises 1, 6 and 7 are shown in Figures 33 and 34. On the basis of these diagrams, comment on the symmetry and/or skewness of these data.
Discussion
For the boxplot of arithmetic scores, the left part of the box is longer than the right part, and the left whisker is also considerably longer than the right. This batch is left-skew.
For the boxplot of television prices, the right part of the box is rather longer than the left part. The right whisker is also rather longer than the left, and if one also takes into account the fact that two potential outliers have been marked, the top 25% of the data are clearly much more spread out than the bottom 25%. This batch is right-skew.


