Seeing the light
Use 'Print preview' to check the number of pages and printer settings.
Print functionality varies between browsers.
Printable page generated Friday, 22 May 2026, 5:21 PM
Seeing the light
Introduction
One of the most important things that supports life on the planet, and one of the fundamental things we need as humans, is natural light. It allows plants to grow, it provides warmth and it allows us to see what we are doing when going about our everyday lives. So it is no surprise that in creating new homes the amount of light that they let in is of great importance. In this free course, Seeing the light, we explore what natural light gives us in our lives and the other benefits it can bring. We are dependent for our natural light on the Sun, but the Sun also brings us heat and energy.
This course will teach you about how the Sun affects your home, both in terms of light and warmth and the energy it generates. You will learn about how it can affect your health and wellbeing, and how homes in different climates are designed differently to maximise the benefits of the Sun. You’ll start by seeing the consequences of living without enough light, before going on to think about how building shapes and orientations can affect our comfort levels in terms of warmth and light. You’ll complete some practical exercises in your own home, or a building you are familiar with, and to end the course you will review your work.
This OpenLearn course provides a sample of level 1 study in Science
Learning outcomes
After studying this course you should be able to:
demonstrate knowledge and understanding of some of the basic facts about language, concepts and principles relating to the principles of design of a home
understand how to extract information from sources such as text and video
demonstrate mathematical skills appropriate to making energy calculations about solar panels.
1 Light
We will begin by watching the first part of a specially commissioned Open University/Channel 4 television programme about our homes which features The Times architecture critic Tom Dyckhoff. The programme, The Secret Life of Buildings, looks at many different aspects of architecture and design in exploring our relationship with the buildings around us. It also shows a number of experiments to illustrate how buildings can affect our behaviour.
How to watch a programme
You will probably be used to watching television programmes for entertainment, but watching programmes for study requires different skills. To watch effectively you need to have a pen and paper handy to make notes. It is also recommended that you watch the programme more than once to become really familiar with the ideas and examples that are presented.
As you watch the first time, try to summarise quickly each little segment that forms the structure of the programme. What is the main point that is being made for each one?
Before you watch a second time, note down what you didn’t understand when you watched the first time. Were there any explanations that didn’t quite make sense to you? Did you forget any examples that were mentioned? Look through the questions that follow the programme and note down what you need to focus on to answer them.
As you watch a second time, you will find that, knowing broadly what is coming, you can be freer to concentrate on the details that you might have missed the first time. You can also try to clear up any misunderstandings you had from your first viewing, and note down the answers to any questions you are asked. Remember you can always press ‘pause’ to collect your thoughts and write more detailed notes before continuing.
2 The Secret Life of Buildings
Activity 1 The Secret Life of Buildings
Watch The Secret Life of Buildings. As you watch it, try to make notes about the key points made. Then answer the questions below.
Transcript: The Secret Life of Buildings
- a.What is the unit for measuring light?
- b.What are the light levels:
- i.outside in an urban centre?
- ii.in the average British home?
c.In the programme, the presenter, Tom Dyckhoff, is tested to see how he reacts to decreased light levels. What was the light level in Dyckhoff’s home when the window sizes were reduced?
- d.What different tests are carried out on Dyckhoff and what two main things do you think they are measuring?
- e.What are the effects on Dyckhoff from living with reduced light levels for a week?
- f.What might these effects lead to if the experimental conditions continued?
- g.How could these effects be reduced for people living in conditions of low light?
Discussion
- a.The unit for measuring light is the lux.
- b.The programme states that:
- i.the amount of light outside in London is between 20 000 and 30 000 lux
- ii.inside the average home it is between 200 and 300 lux.
c.In the programme, it was shown that the light levels in Dyckhoff’s home were reduced to about 50 lux when the windows were boarded up.
d.Dyckhoff has tests on his urine and blood to determine, among other things, his glucose levels. He also completes a couple of questionnaires: one to determine how tired he feels and the other to determine his mood.
The blood and urine tests measure directly how the body is responding chemically, while the questionnaires test how Dyckhoff is feeling during the experiment. Usually the two things are related, but that is not necessarily the case. So, the blood and urine tests are measuring what we call objective things (for example, things that we can accurately put a number to) and the questionnaires are measuring what we call subjective things (for example, things that we feel).
- e.After the one-week experiment, Dyckhoff’s glucose levels have gone up, his feelings of tension, anxiety and depression have all increased, his activity and vigour have decreased, and his ‘body clock’ has begun to drift, in what the tester calls ‘internal desynchronisation’. Of course, this cannot definitely be due to the decreased light levels alone – Dyckhoff was also not allowed to leave his flat for the week long experiment. So as well as being subjected to low light levels, he was also probably not getting the same amount of exercise and social interaction as normal – which is likely to have also contributed to his increases in anxiety, depression, etc. and his metabolic changes.
- f.If the experimental conditions were to continue, Dyckhoff might be more likely to develop diabetes, suppression of the immune system, increased susceptibility to disease and depression.
- g.One way to reduce the effects would be to spend more time outside in the open, where light levels are highest. A good walk is a cure for a lot of things!
Measuring light
Activity 2 Measuring light
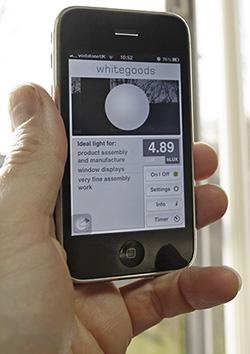
Do you think the light levels in your home are above or below average? If you have a smart phone you can download a free light meter app, such as ‘whitegoods’. Then, to calculate an average value you could take readings at midday, and in the centre of every room in your home. Add these readings together and divide by the total number of rooms to reveal a good estimate of the average levels of light in your home.
Discussion
Measuring the average light in your home is not as straightforward as perhaps the programme leads you to believe. There are some dark places (for example, your cellar) as well as very light places (for example, by a south-facing window). Light levels would also depend on when you took your light readings, as the intensity and quality of light changes through the day.
3 Here comes the Sun
The most basic purpose of the place that we call home is to provide accommodation that shelters us from the rigours of the natural environment. The natural environment is often inhospitable, or certainly less comfortable than most people prefer: it is frequently too hot, too cold, too wet or too humid. This suggests that there is some kind of ‘comfort zone’ within which people prefer to live: a zone of limited ranges for the various aspects of climate that humans are capable of sensing, such as temperature. The ‘comfort zone’ of a home can be influenced by several basic things, including its overall shape, the materials used in its construction and its orientation. In this section we will concentrate on the last of these, the orientation of the building.
Temperature and comfort
Activity 3 Temperature, warmth and coolness
We tend to think of somewhere comfortable as being somewhere that is warm in the winter and cool in the summer. What do you think the differences are between temperature, on the one hand, and warmth or coolness, on the other?
Discussion
Many people argue that these are the same thing, but you might think there is a significant difference. We usually think of temperature as a simple number that provides a measurement of the hotness or coldness of something. Warmth and coolness, on the other hand, have a feeling and value associated with them, especially in the context of a home. Warmth in the winter and cool in the summer makes us feel good, while temperature just ‘is’. Designers often make use of this distinction in their work. They aim to create a home that is warm or cool – and that can be done in a combination of ways, including the use of colour and materials – rather than a home that operates at a certain temperature.
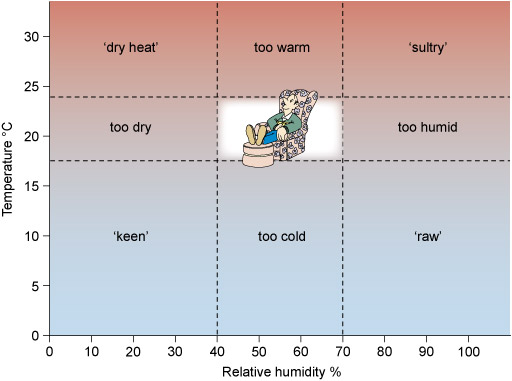
It is in fact very difficult to reach universal agreement on the meaning of ‘comfort’; usually the best that can be done is to define it as an absence of discomfort. Discomfort is to be, for example, too hot or too cold. There are also considerable differences between the levels at which people begin to feel uncomfortable. For Europeans, the comfort range for air temperature is about 18 to 24 °C. However, what is ‘comfortable’ also depends very much on what you are doing at the time; strenuous physical activity needs a much lower air temperature for comfort than sitting in a chair. Figure 2 shows in very simplified form the ‘comfort zone’ for sedentary activity, in terms of temperature and humidity.
Obviously the UK temperature will sometimes fall within the comfort zone shown in Figure 2, and (if the other factors that influence comfort, such as air movement, are also within comfortable limits) at these times it is quite possible to be comfortable out of doors without any shelter. However, as you will probably know, in the UK, the number of days in a year in which all the comfort factors are satisfied is actually rather few. So, for a comfortable life, shelter from the elements is needed for most of the year in UK. A simple shelter would provide some protection (principally against wind and rain) and would be adequate for the few summer months, but for the rest of the year not only is shelter needed but also some more active forms of modifiers of the climate, particularly some form of heating.
Heating a home
How do you heat your home? A quick answer might be: with central heating! You might well be right, of course, but there is another major source of heat in the home and that is the Sun. You may have noticed that some homes, or some rooms in a home, are more of a ‘sun-trap’ than others. This is because their orientation (particularly that of their windows) towards the Sun means they pick up significant quantities of solar heat on sunny days. This is called ‘solar gain’ and it has become an increasingly important factor in the design of new homes.
Activity 4 Heat from the Sun
Can you think of any ways in which the Sun can provide heat to a home?
At present, the majority of homes in the UK do not have solar panels installed, though that is slowly changing due to government initiatives in renewable energy (energy that comes from natural and infinite sources like the Sun, wind, and the sea without the need to burn and use up valuable fuel). At the moment most people will only experience the direct effect of the Sun in their homes.
Activity 5 Other sources of heat
Apart from the heating system that you have in your home – solar powered or otherwise – can you think of any further sources of heat?
Discussion
People give off heat, and the more of them you can fit into your home the less you will need other sources of heat, as you may have noticed at a crowded party. Household appliances are also incidental sources of heat. A refrigerator, for example, gives off some incidental heat, as do computers, television sets and other electrical appliances. Cooking also gives off heat, as do lights.
4 What is your orientation?
A critical determinant for how much heat a building needs is its orientation in relation to the Sun. A building that faces the Sun without any obstruction – a south-facing house with an unobstructed view of the sea, for example – will be much warmer than one that doesn’t. Remember, however, that the position of the Sun changes throughout the day, so a house that faces the Sun in the morning might not necessarily face the Sun in the evening.
Usually, though, the orientation is determined by many other factors: the need to fit a number of buildings on a restricted site, the need to link with roads and other existing networks, the need to take into account the surrounding landscape and other buildings. For example, if houses are built in terraces on either side of a road, one side will always get more Sun than the other side.
Activity 6 Sunlight and orientation
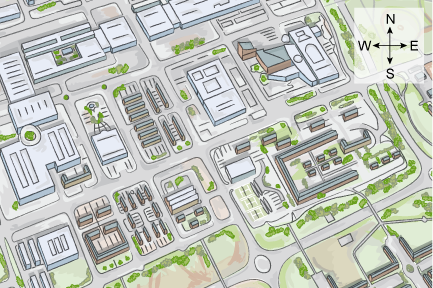
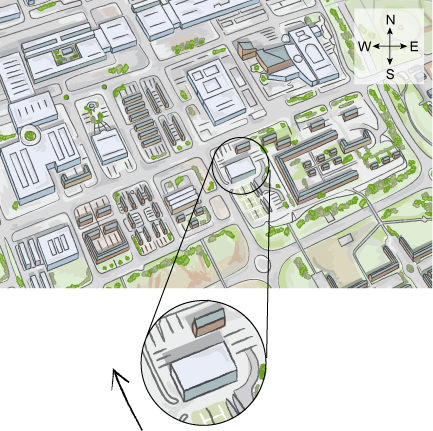
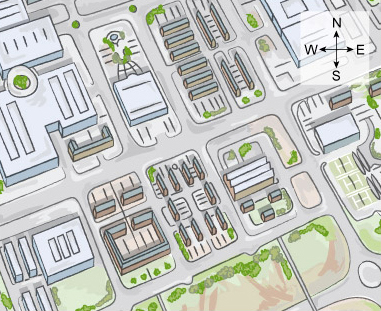
Take a good look at the picture below, which shows a bird’s eye view of streets and buildings. The image is oriented so that the top points north, the right-hand side points east, the bottom points south, and the left-hand side points west. Which way do you think the Sun is shining? Where do you think the sunniest house in the picture is, and where do you think the least sunny house is?
Discussion
The sequences of pictures below answer the questions above.
The best way to determine which direction the Sun is shining in is to look at shadows. If you look carefully at the first image, you can see shadows next to the north-west facing sides of the buildings, and that reveals the direction of the Sun as being from the south-east. Another telling shadow is cast by the large building next to the tennis courts, circled and enlarged in the first image below.
The second image shows the buildings that are likely to be the sunniest. These are the buildings which face towards the south, and which don’t have too many obstructions around them. The big building surrounded by the tennis courts and other green space is likely to have the most Sun of all.
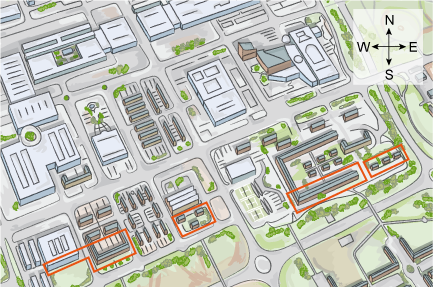
The third image shows the buildings that are likely to be least sunny. These are east and west facing with obstructions all around them. They will get some sunlight through the day, but it will be far less than the sunniest houses.

Building shapes and climate
It is nevertheless possible to consider the overall shape of a building and its orientation on an idealised open site and to reach conclusions about the best design that is suited to a particular climate. There are four principal types of climate: cold, temperate, hot-arid and hot-humid that lead to different forms of building (Figure 5).
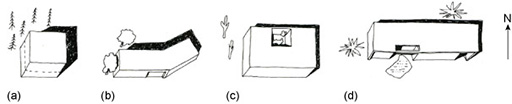
In cold regions the need to conserve heat is very important and leads to trying to minimise the outer surface area of the home, in order to reduce heat loss. This minimum surface area is achieved, for example, in the hemispherical (half-sphere) form of the igloo.
In temperate regions (such as the UK) a rectangular plan is desirable, with the shorter sides facing east and west. Such a home has a long southern face, which catches the Sun when it is available. Because the climate is not so extreme in temperate regions, however, more diversity in home shapes is possible in without significantly affecting heat gain or loss.
In hot-arid (desert) regions the extreme conditions demand a return to a more compact shape, with the addition of special features such as internal, shaded courtyards cooled by water to help create a comfortable ‘micro-climate’ within the home and its immediate surroundings.
In hot-humid (tropical forest and swamp) regions the actual temperature is usually not so excessive as in hot-arid regions, but the high humidity significantly affects discomfort. So long as the roof provides adequate shelter against rain and Sun, an open-sided elongated shape has the advantage of being able to catch any cooling breezes.
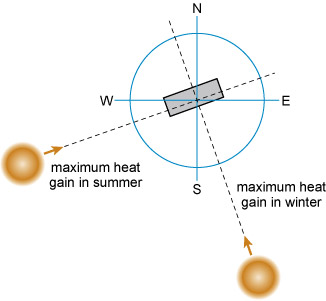
The orientation of the home is obviously important for elongated shapes. Usually the dominant factor is the orientation of the main facade towards the Sun, though other factors (for example, wind direction and ease of access) can be just as, or more, important in planning the orientation of the home. In temperate regions this is a matter of trying to arrange the home shape and orientation so as to collect as much heat as possible from the Sun in winter, while avoiding overheating from solar gain in the summer. In temperate regions in the northern hemisphere the maximum summer solar gain in fact comes from a south-westerly direction, whereas the maximum winter solar gain comes from slightly east of south. These comments apply to the whole home, not just to window orientation, and to the build-up of heat during the whole day. This conveniently means that, in northern temperate regions, the optimum orientation for the longer facade is just to the east of south so as to receive the most winter warmth, thereby turning the shorter facade to the south-west, the direction of highest solar gain in summer (Figure 6).
Homes in different climates
The best way to think about orientation and climate is to think about pitching a tent. Imagine different types of climate and where you’d put your tent in order to minimise the negative effects of the climate and maximise the positive effects. What is the first thing you think of when you arrive at a place to pitch a tent? If it was windy, you’d probably look for somewhere protected from the wind; if it was wet, you’d probably look for the driest place; if it was very hot, you’d probably look for somewhere that was shaded. And the fact that you have a tent probably means that you’d like a good view, so that is something else to think about! What you are doing, in actual fact, is making a design decision; balancing a number of different factors to try to work out what the best (or optimal) solution is.
However good we think our solution is, though, we inevitably find that it can be improved. We might forget to think about where the Sun will come up in the morning if we are pitching our tent late in the day and wake to find we are much too hot. We might have pitched our tent at the bottom of a hill, to keep out of the wind, and wake to find it has rained heavily during the night, and that our tent is now on soggy ground. If we are staying in the same place for another night, we will alter our ‘solution’ accordingly, to further optimise our design.
Activity 7 Climate and house design
With reference to what you have just read, what do you think a sunny, hot climate like that of the south of Spain would do to the design of houses?
Discussion
The climate in southern Spain tends to be hot and arid, especially during the summer months when there is a lot of sunshine and not much rain. This tends to mean that houses are designed more for shade, and the reduction of solar gain, than capturing sunlight. Southern Spain is also famous for its ‘white towns’, where houses are whitewashed to avoid absorbing heat from the Sun (white things absorb much less heat than dark things and stay cooler as a result). In general, southern Spanish houses have relatively small south-facing windows and more shaded spaces, for example by using overhangs or loggia to block direct sunlight in the summer. They also use ‘cooler’ materials, for example terracotta roof and floor tiles, and lightweight bricks that don’t retain heat.

Changing the orientation of a home plan can have a major effect on how much solar heat it might gain. In one orientation a home can be overheated by the Sun in summer, yet get little or no benefit from the Sun in winter; in a different orientation the same home design can be picking up maximum solar gain in the winter, while not becoming overheated in summer.
To understand how this change of orientation can be so significant, you need to know something of the Sun’s apparent movement in the sky (Figure 8).
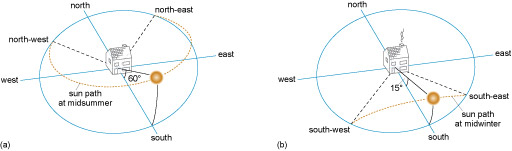
The Sun’s relationship to the Earth is constantly changing – through days, months and seasons, which means it is never in quite the same position. In the UK in midsummer, the Sun rises in the north-east and sets in the north-west and at midday reaches an angle overhead of approximately 60° to the horizontal. In midwinter, it rises in the southeast and sets in the south-west, and at midday reaches an angle of only 15° to the horizontal. Between midsummer and midwinter the apparent path of the Sun varies between these extremes.
Activity 8 Which home for which climate?
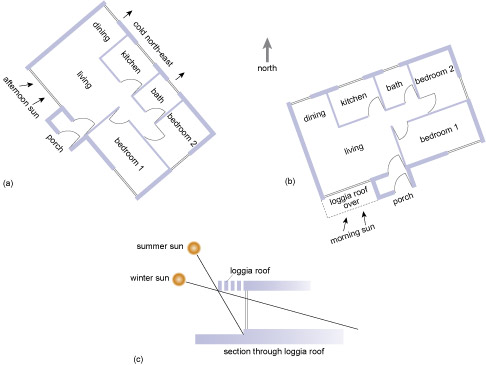
Look at the figures below and try to work out which home would suit the UK climate and which would suit the southern Spanish climate. Ask yourself which rooms would benefit from solar gain, and at what time of year. What function do you think the overhanging roof achieves?
Discussion
Figure (9a) is more suited to the UK climate and (9b) is more suited to a Spanish climate. In (9a), the living room and bedroom 1 face the south-west and gain the maximum midsummer solar heat, but in midwinter they receive light from the setting Sun too late in the day to gain much benefit from it. In (9b), the living room and bedroom 1 face the southeast and receive the morning Sun, which helps to warm the home in midwinter but which doesn’t cause them to become too hot in summer. The overhanging roof shades the main living room windows from the hottest south and south-westerly Sun in midsummer, but in midwinter the Sun is lower in the sky and therefore penetrates below the shading angle of the roof. Also, in (9b), the dining room and kitchen pick up the late-evening summer Sun in the north-west, which might be welcome, and both bedrooms receive early-morning Sun for most of the year.
5 The solar century
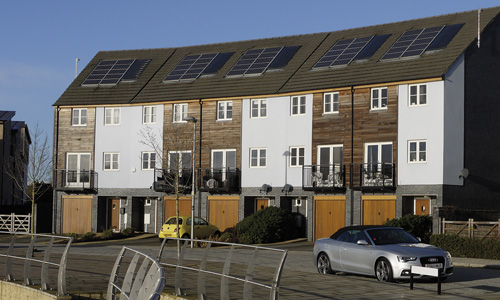
In the present-day UK more and more homes are making use of solar panels to convert the Sun’s energy into electricity or hot water. This can mean cheaper bills at a time when energy is becoming an increasingly scarce resource and thus more expensive. Figure 10 shows some images of energy generation from the Sun. The size and arrangement of some of the solar arrays in the desert can be truly astounding.
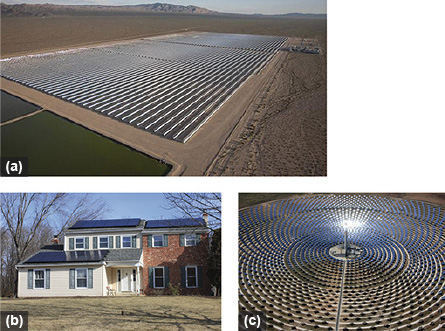
Many new houses have solar panels built into the fabric of the building (for example those in Figure 10b, above) and it is an area that will become increasingly important in our future energy generation. The solar panel technology has been developing since the invention of photovoltaic technology (which is the technology used in solar panels that convert solar energy to electricity) in the mid 1950s and, although still expensive, is now becoming increasingly viable for meeting a home’s energy requirements. To function effectively, however, solar panels need as much direct sunlight as possible and this means that orientation is key.
Activity 9 Which roof is better for solar panels?
The figure below shows one of the terraced streets you saw when you did Activity 6. Some of the buildings in the drawing have ‘pitched’ roofs – ones where the two sides of the roof are sloping and meet along a ridge – these are ideal for mounting solar panels. As before, north is towards the top of the figure. Look at the figure and, for two or three different houses or buildings, work out which bit of roof would generate the most electricity from solar panels. What implications does the constantly moving Sun have for solar panels?
Discussion
You would put your panels on the part of the roof that was most south-facing. In the figure, there are no roofs that face directly south (towards the bottom of the photo) but there are plenty of roofs which face south-east or south-west. The big building at the bottom of the photo, for example, has a large expanse of roof facing south-east that would be ideal to mount some solar panels.
Although solar technology has developed so that the angle of the sunlight is less important, the more direct the sunlight – the more it falls at a 90° angle (a right-angle) onto the solar panel – the better. This means that solar panels that ‘track’ the Sun as it moves through the sky could potentially generate more energy. Imagine, for example, a field of sunflowers, and how the head of each sunflower moves to face the Sun right through the day to capture as much Sun as possible.
A drawback might be that the energy used by the tracking system would detract from the energy generated as well as needing more maintenance, so in practice what’s called a ‘static array’, provided it is south-facing, is the cheapest and most efficient.
Activity 10 Katie’s house
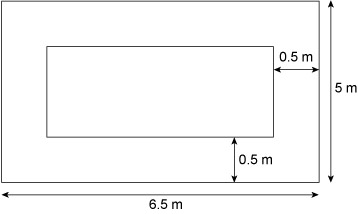
Question 1
- a.What is the area of the south-facing roof panel?
- b.Katie has been advised to leave a 0.5 m border around the edge of her roof as shown in above. What area is available for solar panel use?
Discussion
- a.The area of the south-facing roof is 6.5 m × 5 m = 32.5 m2.
- b.5 m – (2 × 0.5 m) = 4m.
The length of the rectangle in which solar panels can be fitted is 4 m.
Similarly the width of the rectangle is 5.5 m.
This gives an area of 4 m × 5.5 m = 22 m2.
Question 2
The roof panels Katie is looking at measure 1.6 m (length) by 0.9 m (width). The panels fit exactly next to each other with no overlap or gap. The panels have to be fixed so their length is along the length of the roof.
- c.How many panels can Katie fit in the available space on her roof?
- d.Find the area of a roof panel. Explain why your answer to part (c) is not the same as the calculating the area of the roof space available divided by the area of a roof panel.
e.Each panel gives 200 watts (W) of power. Using your answer to part (c), find out how much power Katie will get from her solar panels. Give your answer in kilowatts (kW) to 1 d.p. The watt is the SI unit for power, and a kilowatt is 1000 watts. Hence to convert from W to kW, divide by 1000.
Discussion
- c.The panels stay in the same orientation.
5.5 m ÷ 0.9 m = 6.111.
Across the width we can fit 6 panels.
4 m ÷ 1.6 m = 2.5
In the length we can fit 2 panels. This means there is room for 12 panels on the roof altogether.
- d.Find the area of a roof panel. 1.6 × 0.9 = 1.44 m2. Divide the available roof area by the panel area. 22 ÷ 1.44 = 15.3 (1 d.p.).
The difference arises because we round the values for the length and width before multiplying in the first case. We can’t use bits and pieces of panels to cover the area but can only work in whole panels.
- e.There are 12 panels each giving 200 W of power. 200 W × 12 = 2400 W.
So we get 2400 W of power in total. To convert to kilowatts (kW), divide by 1000.
2400 W ÷ 1000 = 2.4 kW.
So, the system will give 2.4 kW of power.
Study note: information from figures
Activity 11 Information from figures
Look back over Figures 2, 5, 6 and 8. Think about the nature of each figure – what kind of information or idea is it conveying? See if you can understand the significance of each illustration and how it relates to the ideas developed in the text. Consider why these figures have been included, and whether it might have been possible or preferable to have conveyed the ideas in words.
Discussion
Each of the figures in this section is of a different type, although several of them may look rather similar.
The first, Figure 2, conveys in a simple visual form a lot of data and related information about people’s responses to temperature and relative humidity. To convey the same information in words would have meant a lengthy and complicated piece of text, and it’s almost certain that you would not have grasped the information as readily as you can from the illustration. Notice how the shaded area implies that the ‘comfort zone’ is less well-defined than might be suggested by the rigid rectangle enclosed by the dotted lines. The drawing inside the zone also implies the kind of activity for which this zone is ‘comfortable’.
Figure 5 is a different kind of illustration. It doesn’t really convey any more information than the article it accompanies, but it shows examples of the types of building forms that are outlined in the text. It therefore makes the text easier to understand. You might also find the pictures easier to remember than the words in the text.
The next illustration, Figure 6, is a graphical representation of some principles that are also explained in the text. The drawing enables you to literally ‘see’ what the author means; how the two important orientations happen to come conveniently at right-angles to each other.
Figure 8 is a visualisation of something that happens in three-dimensional space and time – the apparent motion of the Sun through the sky. Once again, the illustration easily conveys something that is much more difficult to convey with words alone; and it helps you to understand the text.
The figures are not there just to make the website look more attractive! Since technology is so often about real-world objects, illustrations are used in technology courses to explain those objects, and also to help you to ‘visualise’ the ideas connected with those objects.
Your home’s orientation
Activity 12 Your home’s orientation
The purpose of this activity is to help you to work out how well the place where you live has been shaped and oriented to take account of the Sun’s apparent movement around it. If you like, you can choose another building that isn’t your home for this activity.
For this activity you will need three different coloured pens, as well as a compass or something else to draw large circles with, a pencil and some paper.
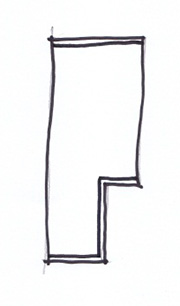
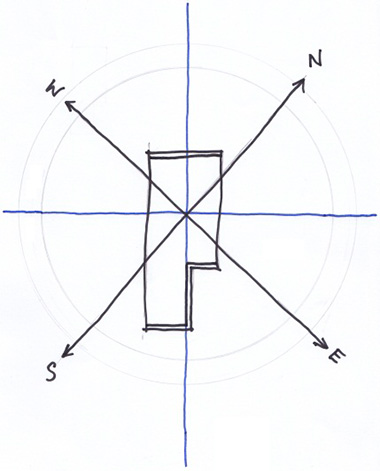
Draw out the shape of your home as if a bird was looking down on it from above. You might like to use the satellite view in Google Maps to help you: magnify it as much as you can and print it out if you need to. Try to get a sense of the proportions of your home in order to draw its shape. Make a double line for walls that have windows in. See below for an example, which is a terraced house.
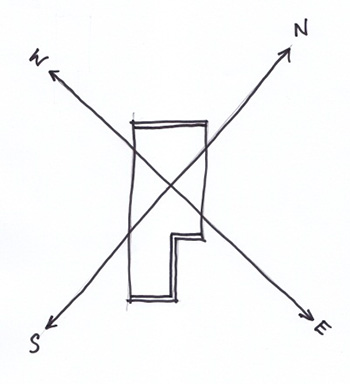
Establish where north is in relation to your home. The simplest way to do this is to use Google Maps, which has north at the top of the screen, but you could also use a compass, or observe where the Sun is at midday (13:00 in British Summer Time), which will always be south.
Draw a north–south line through the middle of your home, and then draw the corresponding east–west line through the same point as shown below.
You now need to draw lines that show approximately where the Sun rises and sets in summer and in winter. To do this, imagine that the north–south and east–west lines have turned, like a wheel, through 45°. Draw these lines, in a different colour, through the centre of your home as shown below.
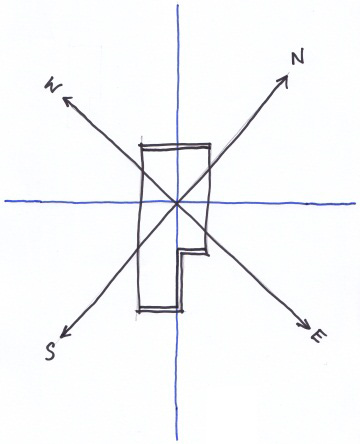
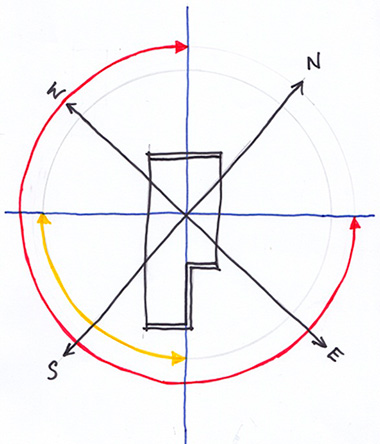
Next, using a compass, or by holding a bit of string tied to a pencil, lightly draw two large concentric circles from the centre of your home all around it as shown below.
You now need to draw a line that represents sunrise (towards the east) to sunset (towards the west) in midsummer. With a red pen or pencil, trace the outer circle clockwise from 45° on the east side of north to 45° on the west side of north.
Next, draw a line that represents sunrise to sunset in midwinter. With a yellow pen or pencil, trace the inner circle clockwise from 45° on the east side of south to 45° on the west side of south.
Your drawing should now look like this:
- Work out which side of your home, and which window, provide the best orientation to the Sun throughout the year. If you could, which way would you turn your home to improve its orientation?
Discussion
The home in the example is an L-shape with its front in a north-west direction and its back in a south-east direction. That means that the windows at the back of the house get the most sunlight. As it is a terraced house, there are neighbours on each side, and that means it doesn’t get as much sunlight as it could.
The sunniest window is the one right at the back of the house. If this house was turned clockwise a little, it would get a bit more sunlight later in the day. It was probably a combination of existing roads and the nature of the landscape that prevented this ‘optimal’ orientation when the house was first built.
Conclusion
In this course, you will have learned:
- how the Sun affects your home, through both the light that it gives and the energy it can generate
- how important the Sun is for our basic health, as well as what happens when you don’t have enough of it
- how the Sun plays a major role in heating and lighting a building, through looking at the shape of buildings and their orientation
- how to make an energy calculation for solar panels.
References
Acknowledgements
Except for third party materials and otherwise stated in the acknowledgements section, this content is made available under a Creative Commons Attribution-NonCommercial-ShareAlike 4.0 Licence.
Course image: Rishi Bandopadhay in Flickr made available under Creative Commons Attribution-NonCommercial-ShareAlike 2.0 Licence.
The material acknowledged below is Proprietary and used under licence (not subject to Creative Commons Licence). Grateful acknowledgement is made to the following sources for permission to reproduce material in this course:
Video image: Publicity still of presenter Tom Dyckhoff from The Secret Life of Buildings
Activity 2 image: © Peter Lloyd
Activity 4 image: © Peter Lloyd
Activity 7 image: © Patrick - Giant Ginkgo. This file is licensed under the Creative Commons Attribution-Noncommercial-ShareAlike Licence http://creativecommons.org/ licenses/ by-nc-sa/ 2.0/
Figure 10 (a): © avdweb 2013
Figure 10 (b): © Montgomery County Planning Commission. This file is licensed under the Creative Commons Attribution-Noncommercial-ShareAlike Licence http://creativecommons.org/ licenses/ by-nc-sa/ 2.0/
Figure 10 (c): Gemasolar solar thermal plant, owned by Torresol Energy ©SENER
Every effort has been made to contact copyright owners. If any have been inadvertently overlooked, the publishers will be pleased to make the necessary arrangements at the first opportunity.
Don't miss out:
If reading this text has inspired you to learn more, you may be interested in joining the millions of people who discover our free learning resources and qualifications by visiting The Open University - www.open.edu/ openlearn/ free-courses