
3.2 The density of fresh water and seawater
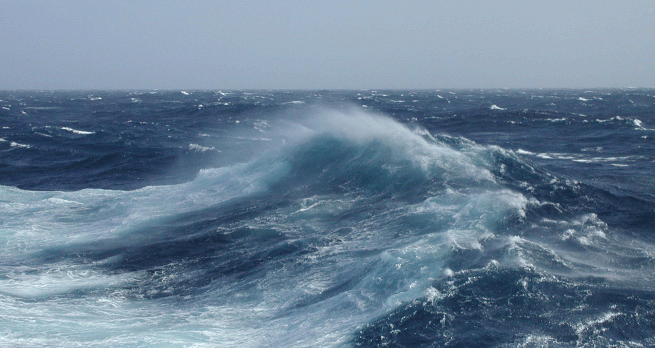
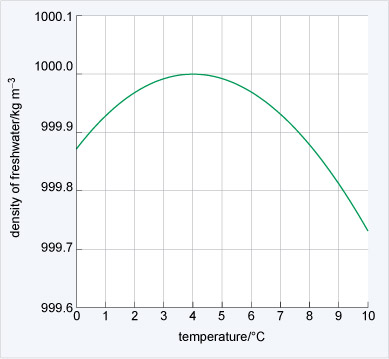
Fresh water and seawater have very different physical properties. Imagine a freshwater lake in winter. As the air temperature falls the temperature of the water at the surface decreases and its density changes (Figure 4).
-
What is the temperature at maximum density?
-
The maximum density is at ~4 °C (Figure 4). At both lower and higher temperatures than this the water is less dense.
While it is hard to see on the scale in Figure 4, the maximum density is at 3.98 °C. As a lake cools to this temperature in winter the surface waters will sink through convection and warmer water rises to the surface. With continued cooling this warmer surface water also becomes dense and sinks. As the surface water is being cooled the lake will become stratified. That is, the density will increase with depth to 1000 kg m−3, and the deep water will have a temperature of 3.98 °C. Imagine the convection continuing until all the water has reached 3.98 °C.
-
What will happen to the water in the lake when all the water is cooled below to 3.98 °C?
-
The water at the surface of the lake will cool and become less dense. This means that it will not sink away from the surface. So the lake will end up with a cool surface layer with warmer, denser water beneath.
Eventually the surface layer of water will be cooled to the freezing point (0 °C) and ice will form on the surface. At this point the temperature and density of the water will have a structure like that shown in Figure 5.
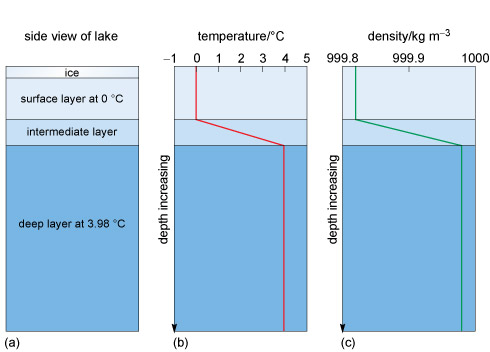
Figures 5b and c show that the temperature and the density increase with depth from the surface to the bottom layer, where the temperature is 3.98 °C and density is at its maximum.
Let us think about this a little more.
Usually when a liquid is heated the molecules acquire more energy and become more widely spaced, so in the same volume, the density decreases. In fresh water the opposite may happen, depending on the temperature. When fresh water at 3.97 °C (Figure 4) is cooled the density will decrease. You know from the lake (Figure 5) that ice (i.e. solid water) is less dense and floats. But cooling a liquid usually packs the molecules more closely, which increases the density. This means that below 3.98 °C cooling results in the water molecules spacing out and both the liquid and the solid water below this temperature expand. This is an amazing physical property and is why pipes burst and water in cracks shatters rocks in cold temperatures. The molecular structure of a water molecule is shown in Figure 6.
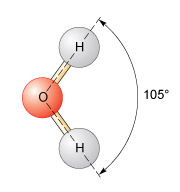
In H2O, the oxygen and the hydrogen atoms share electrons, and the angle between the two hydrogen atoms is 105°. This results in a small net negative charge on the oxygen side of the molecule, and a small net positive charge on the hydrogen side. This is a polar structure in which molecules are weakly attracted to each other and form weak 'hydrogen bonds'. At low temperatures a more ordered packing of water molecules develops and the density is reduced. If the temperature is increased but is
Seawater is saline and the salt affects the density. Figure 7 shows the vertical structure of the temperature, salinity, and density at latitude 20° S in the Atlantic Ocean over an abyssal plain almost 5300 m deep.
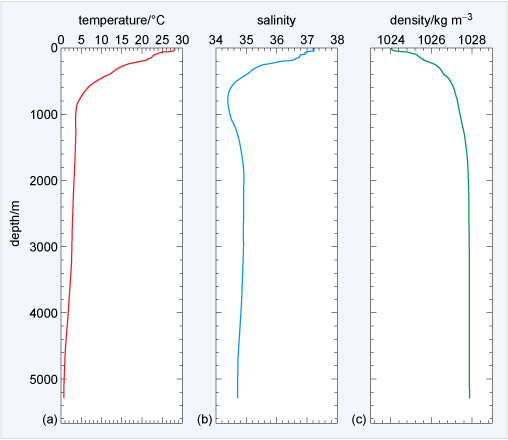
Figure 7a shows 28 °C temperature at the surface to below 1 °C at the sea floor. The variation in salinity in 7b clearly affects the temperature of maximum density shown in 7c. The seawater density ranges from 1024 to 1028 kg m−3, ~24-28 kg m−3 denser than fresh water (Figure 4), and density increases with depth and the water is stratified all the way to the sea floor (although >3 000 m depth there is only a small increase). Because seawater is typically 1024-1028 kg m−3 there is a density anomaly, σt (pronounced 'sigma t') given by:
where ρ is the density of water.
-
What is the range of σt for typical seawater?
-
The density anomaly for typical seawater is in the range 24-28 kg m−3.
Box 1 explains how the physical properties shown in Figure 7 are measured.
Box 1 Measuring the physical properties of the ocean
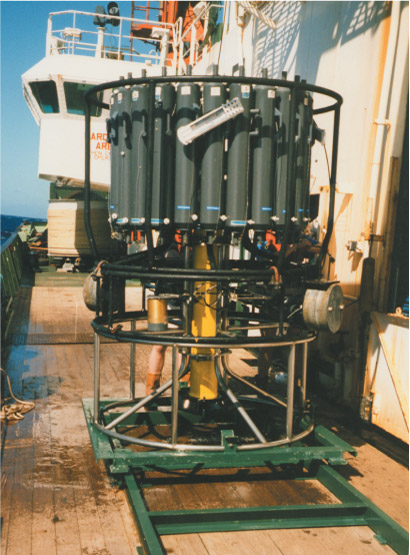
Much of our knowledge about how the oceans circulate is based on measuring the various parameters such as temperature and salinity from the surface to the sea floor. The water which makes up this range is called the water column. The most important instrument used by oceanographers is called a CTD (Figure 8), which measures the conductivity and temperature of the seawater and depth (pressure).
Because pressure in the ocean is proportional to the weight of the water above, it is given by the hydrostatic equation:
where p is pressure, z is a change in depth and g is the acceleration due to gravity. The minus sign indicates that the vertical coordinate z (depth) is positive in an upwards direction. So by measuring pressure, Equation 2 can be arranged to get depth.
Other parameters can also be measured, such as sediment particle density, the amount of chlorophyll present (in algae), and so on. A CTD is lowered from a ship on a winch at a rate of ~60 m min−1. If the ocean is 5300 m deep, as in Figure 7, a round trip is 10 600 m and one profile can take almost three hours.