
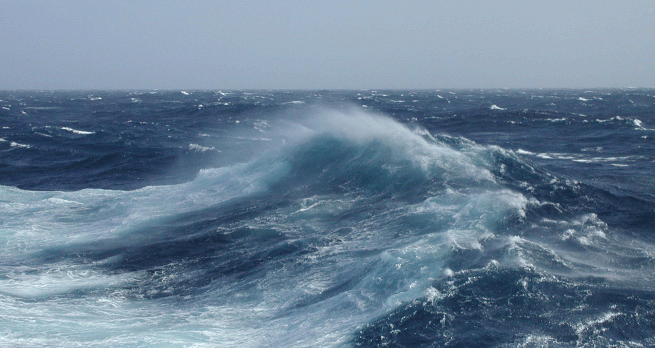
4.6 The frozen seas
Because of the effects of temperature and salinity on the density of seawater (Figure 12), the cold polar seas have a tremendous climate impact on the rest of the planet.
Ice forms first as small crystals called frazil ice. These form at the surface and develop a layer that looks similar to an oil slick (Figure 21a). The crystals then coalesce to form small plates called pancake ice, which have rounded edges caused by constantly being bumped (Figure 21b). As more seawater freezes, the pancakes grow up to 3 m in diameter and eventually freeze together or are piled up on top of each other by storms to form larger ice floes. Water can freeze onto the bottom and snow falls on the surface, increasing their thickness to typically more than 2 m (Figure 21c).
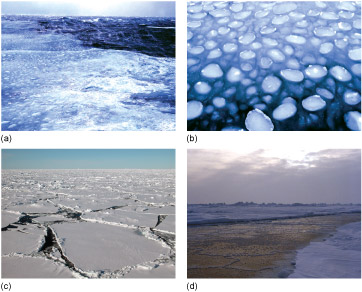
A large area of this ice is called pack ice or simply 'the pack'. When conditions are calm the frazil ice can develop directly into large sheets of ice and so miss out the pancake stage. The ice floes can be kilometres wide and the gaps between individual floes small. The breakup of sea ice is not simply the reverse of the sequence when ice grows; the large ice floes break up into small floes and then melt straight into water.
Activity 2 Sea ice in the climate system
Part 1: The growth of sea ice
Watch Video 6 about the process of sea ice generation, recorded for the BBC television series Life in the Freezer. Make notes as you watch it. Once you have watched the video, try to answer the questions below.
Transcript: Video 6 Process of sea ice generation.
Question 1
At what temperature does the sea freeze?
Answer
The commentary says that the sea begins to freeze at -1.9 °C.
Question 2
What causes the sea ice crystals to develop into pancake ice?
Answer
A slight swell on the surface of the ocean causes the crystals to coalesce and form the pancakes.
One feature notable by its absence in the clip you have just viewed is bad weather! That clip clearly focuses on film recorded either from the shore or in calm seas. Undoubtedly, most of the sea ice growth that happens at both poles takes place in winter, and in bad weather.
Part 2: Sea ice growth in Antarctica
Video 7 was recorded by satellite and shows the ocean around Antarctica covered by sea ice. At the bottom of the map is the date, on the left-hand side the day of the year, and on the right-hand side the day, month and year. Green, yellow, red and purple represent sea ice concentration, light blue represents open water and the grey areas represent land such as Antarctica and South America. View the clip now and focus on where the ice remains throughout the entire Antarctic summer.
Question 3
Where does the sea ice remain throughout the Antarctic summer?
Answer
In January 1998, the sea ice remains mainly close to the coasts and in one location called the Weddell Sea.
Question 4
Now view Video 8. It shows the same information as the previous clip but much faster. This time focus on the proportion of the year that the sea ice is growing compared with the proportion of time that it is decaying.
Does the sea ice in Antarctica grow and melt at the same rate throughout the year?
Answer
No, the cycle is asymmetric. The sea ice grows over a longer period (~6 months) than its seemingly rapid retreat (~4 months).
Part 3: Sea ice growth in the Arctic
The Arctic Ocean is a deep sea covered by a relatively thin layer of sea ice a few metres thick. Video 9 is quite long, so you should start it now and then read the explanation below as you are watching it.
In the video the white and shades of light to dark blue that are expanding and shrinking show the concentration of sea ice similar to that in the previous clips in the Antarctic. This was recorded by the same satellite as previously. The date for the ice concentration is shown in the top left corner as year-month-day, so '1994 7 16' represents the ice concentration on 16 July 1994.
Finally, there are the locations and drift tracks of what are called IABP buoys. This stands for International Arctic Buoy Programme buoys: small scientific packages which are deployed on the ice and report their position and weather data such as air temperature and air pressure. The location of the actual scientific package is shown as a red dot and there is a trail showing where the buoy has been. When the ice melts the buoy sinks and then is lost.
Watch the video all the way through and then try to answer the following questions.
Question 5
The drift of the buoys can be shown to represent the movement of the sea ice, ocean currents and winds. However, the drift is generally not smooth: why do you think this might be?
Answer
The buoys sit on the sea ice and so are moved about by the winds. Storms will make them drift both faster and more slowly and in different directions, as will ocean currents.
Question 6
In the bottom left quadrant of the picture is the Beaufort Sea. What is the general sense of movement of the ice which the buoy tracks reveal?
Answer
The buoys drift generally in a clockwise direction around the Beaufort Sea - although sometimes this occasionally completely reverses.
Question 7
In some areas the buoy tracks are almost stationary (i.e. they have short trails behind the red dots), but in other places they seem to drift relatively rapidly (they have long trails behind the red dots). Can you identify the regions where the drift appears to be the most rapid?
Answer
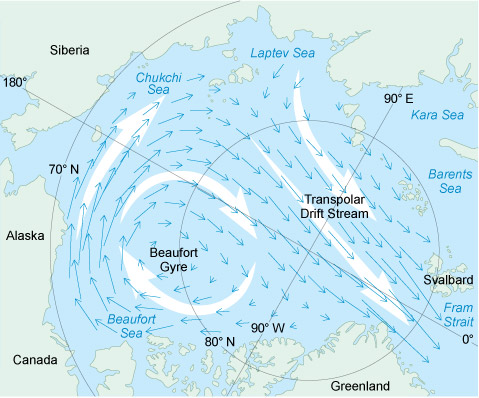
Within the Arctic Ocean the region above the pole shows the fastest drift, from the left-hand side of the frame to the right-hand side. Once the buoys pass the gap between Greenland and Svalbard they rapidly increase in speed, and then disappear as the ice they are resting on melts. Overall the drift of the sea ice in the Arctic can be divided into the clockwise so-called Beaufort Gyre and the transpolar drift as shown in Figure 22.
Question 8
The video of the Arctic showed the drift of the tracks of IABP buoys over (sometimes) many years. Based on what you saw in the distribution of Antarctic ice, why do you think that such buoy drift records have not been made for the Antarctic?
Answer
The videos of the Antarctic showed that most of the ice melts, so there would not be extensive tracks over many years. In areas where the ice does remain over the summer, such as the Weddell and Ross Seas, the drift has been shown to be clockwise.
Further information
Follow the link below if you would like to find out more about the voyage of the Fram when the eminent Norwegian scientist Fridtjof Nansen used the Transpolar Drift Stream in his attempt to reach the North Pole.
Fram expedition [Tip: hold Ctrl and click a link to open it in a new tab. (Hide tip)]
Follow the link below if you want to know more about Ernest Shackleton's drift across the Weddell Sea in a clockwise direction when his ship - the Endurance - was crushed in the ice.