

4.1 Fuel performance
Within an internal combustion engine (ICE), chemical processes take place between the hydrocarbons (HCs) of the fossil fuel, the fuel additives and the gases that naturally occur in the atmosphere – predominantly oxygen and nitrogen. These processes include complete and partial oxidation of the fuel, which produces carbon dioxide (CO2), water (H2O) and carbon monoxide (CO). Nitrogen from the air is also oxidized to nitrogen oxides (NOx). Partially burned and unburned fuel in the exhaust gases forms a complex cocktail of volatile organic compounds (VOCs) together with small particles of matter ('particulates' or PM). Tropospheric (low-level) ozone (O3) is produced by the chemical action of sunlight on the VOCs and subsequent reaction of the products with oxygen in the air. In those countries that still permit the use of 'leaded' petrol, lead (Pb) is also emitted with the exhaust gases.
Petrol and diesel engines differ in their relative emissions performances, with petrol vehicles producing fewer NOx and particulate emissions, and diesel vehicles producing less CO2 per kilometre. The relatively high combustion temperatures attained in a diesel engine explain both diesel's higher NOx emissions (NOx production is predominantly associated with reaction temperature) and its lower CO2 emissions (due to the engine's higher efficiency). Levels of particulates up to 10 micrometres in size (termed PM10) are also higher for diesel, although recent technical improvements are set to almost match petrol engine performance.
Figure 3 compares average petrol and diesel emissions from a typical passenger car with an engine size in the 1.5 to 2.0 litre range. These are measured in laboratory conditions, over a defined driving cycle that represents a mix of urban and longer-distance inter-urban car journeys.
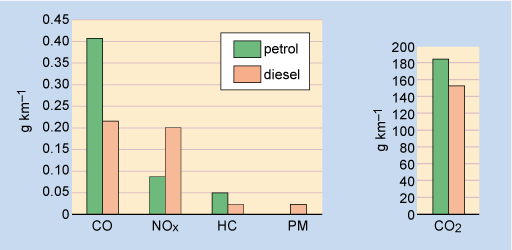
Note the relative levels of CO, NOx, PM and CO2. To some extent, the emission profiles of petrol and diesel illustrate the general tendency for different conventional technologies to 'trade off' emissions against each other. In this case, local air-quality pollutants (NOx, PM) are traded off against global ones (CO2).
It should also be noted that, particularly for fuel consumption and CO2 emissions, on-road performance will be worse than the test cycle. A Dutch study (Linterink and Bos, 2010) showed that actual CO2 emissions and fuel consumption were 20–40% worse than the test figures. This is important as we consider emission reduction technologies, which are always quoted in terms of standard test results. Actual performance in the real world tends to be at least 20% poorer than in the laboratory tests.