

4.4 And so to equilibrium
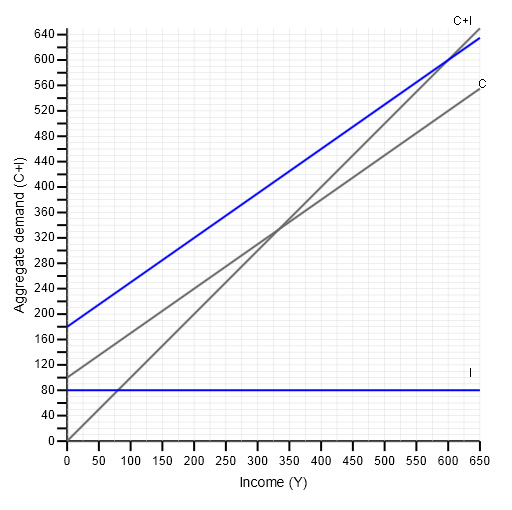
In our diagram, planned saving is shown by the vertical gap between the consumption function and the 45-degree line. Planned investment is shown by the vertical gap between the consumption function and the aggregate demand function.
Given the assumptions we have made about exogenous consumption, the propensity to consume and the level of exogenously determined investment, these two vertical gaps are equal at an income level of £600, so at this income level planned saving = planned investment. We have therefore illustrated an economy in equilibrium at an income level of £600.
Note that the AD line (C + I) crosses the 45-degree line at an income level of £600. Since at any point on the 45-degree line AD = Y, we can say that at an income level of £600 aggregate demand = income.
So we have two ways of looking at equilibrium in this simple economy.
When the economy is in equilibrium:
- Planned saving = Planned investment
- Aggregate demand = Income