

Taxation and the circular flow of income
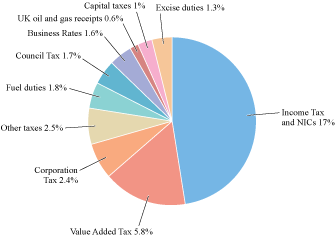
Figure 17, below, gives a breakdown of tax receipts, showing the percentages of GDP allocated to the main types of taxation levied by the UK government. The largest part of the tax take (17% of GDP) is contributed by Income Tax and National Insurance Contributions (NICs). These are direct taxes, payable by the individuals who receive income and by their employers. People who work for an employer have Income Tax deducted directly from their pay each month; for the self-employed, two advance payments are usually made each financial year. Corporation Tax, which makes up 2.4% of GDP, is a direct tax paid by companies directly out of their income, as are Capital taxes (1% of GDP) paid by individuals and companies, charged on increases in the value of financial or physical assets.
The second major source of income is VAT, making up 5.8% of GDP. This is charged on purchases of goods and services. When you buy a car, for example, 20% of the cost will be contributed as VAT. In this case it will be the company that sells you the car that pays this tax over to the government, not you personally. The tax is paid via an intermediary, and can hence be categorised as an indirect tax, as can fuel excise duties, paid via your garage when you buy petrol.
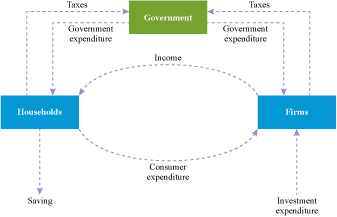
Taxation is a key component of fiscal policy, alongside government spending decisions, which were considered in the previous section. In a period of economic recession, the government can choose to stimulate aggregate demand by either boosting government spending or cutting taxes. This can be illustrated using the circular flow diagram (Figure 18).
Activity 12
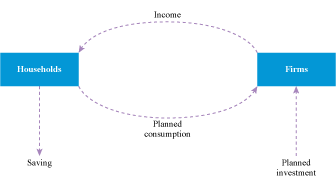
Compare Figure 18 with the circular flow diagram represented in Figure 19.
Discussion
You will see that in Figure 18 a new box has been added to show the government sector. As you have seen, government expenditure provides an injection to the circular flow of income, as indicated by the arrows in Figure 18. For example, if the government-run National Health Service hires more doctors, there is a flow of money to the household sector.
Tax receipts are a leakage from the circular flow of income. For example, out of incomes received by households, a part of these are paid in Income Tax, which leaks out of the household sector into the government sector. A reduction in Income Tax would put money into the pockets of households, which could stimulate aggregate demand. Similarly, Corporation Tax is represented here by a flow of money from the firms to the government. A reduction in Corporation Tax could stimulate the expenditure plans of firms.
The leakage of taxes means that there is another important difference between the two models. In the model without government expenditure (Figure 19), planned consumption is the proportion of income left after saving had been deducted; in Figure 18, consumer expenditure is the proportion of income left after saving and also taxes have been deducted.