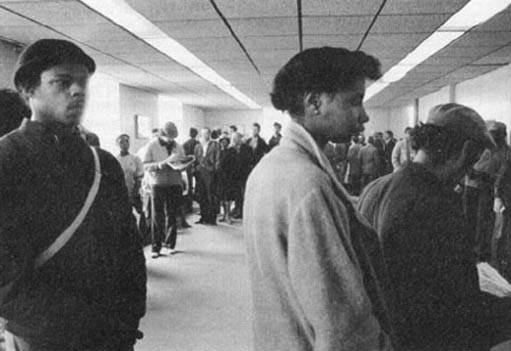
3.2 Ethnicity and disadvantage
Detailed information on other disadvantaged groups in the UK is more limited. Recent studies of the labour market disadvantage faced by Britain's minority ethnic groups indicate not only that they fare badly relative to white employees, but also that their relative position deteriorated throughout the 1980s and early 1990s. According to the General Household Survey, non-white employees in the UK earned 7.3 per cent less, on average, than white employees over the period 1973–9: this deteriorated to 12.1 per cent through the period 1983–9. The Campaign for Racial Equality reports an even larger disparity in earnings: using the Labour Force Survey, they found that the average hourly rate of pay for ethnic minority workers in Inner London was £5.62 compared with a figure of £9.82 for white workers.
A similar picture both of relative disadvantage and deterioration since the 1970s emerges in unemployment rates. Table 4 shows unemployment rates for different ethnic groups since 1979.
| Year(s) | White (total %) | Non-white (total %) | Indian (%) | Pakistani or Bangladeshi (%) | West Indian (%) |
|---|---|---|---|---|---|
| 1979 | 4.0 | 6.0 | 4.8 | 8.1 | 7.3 |
| 1981 | 9.7 | 17.2 | 15.4 | 20.4 | 20.6 |
| 1983 | 12.0 | 22.0 | 17.0 | 32.0 | 28.0 |
| 1984 | 11.0 | 21.0 | 13.0 | 38.0 | 28.0 |
| 1985 | 11.0 | 21.0 | 18.0 | 28.0 | 23.0 |
| 1984–6 | 11.0 | 21.0 | 15.0 | 30.0 | 25.0 |
| 1985–87 | 11.0 | 20.0 | 15.0 | 29.0 | 24.0 |
| 1987–89 | 8.0 | 15.0 | 10.0 | 25.0 | 18.0 |
| 1989–91 | 7.0 | 13.0 | 10.0 | 21.0 | 16.0 |
| 1994 | 11.0 | 25.0 | 16.0 | 29.0 | 33.0 |
What is interesting about this table is that the information is also broken down by ethnic group. This enables us to highlight not just the differences that exist between white and non-white workers but also those that exist between minority ethnic groups. Several points are worth noting. First, unemployment in all the years shown is lower for whites than for non-whites: in 1994 the unemployment rate among non-whites was more than twice that for white workers. Second, although the 1980s was a period of rising unemployment for all workers, the increase was much larger for non-whites than for white workers. Finally, there are significant differences within the non-white population. Workers of Indian descent fared significantly better than workers of Pakistani/Bangladeshi descent; workers of West Indian origin have faced the greatest deterioration in their chances of being in work.
Unemployment among young workers paints an even bleaker picture with 37 per cent of those from minority ethnic groups unemployed in 1994: amongst young black workers the figure is 51 per cent (Blackaby et al., 1995).