
3.3 Quantitative and qualitative evidence
The Tables above provide official quantitative evidence: evidence, data or information which is expressed in numerical terms. On the face of it, this clearly shows that recorded crime increased significantly throughout the twentieth century, albeit with some ‘dips’ in recent years. Common sense is confirmed. But there are problems with these data. Remember, we are looking here at crimes recorded by the police. Do you think that all crimes are recorded? There might be different reasons why crimes are reported. There are changes over a period of a year even, as Table 4 shows. Think back to Activity 2 and the processes by which an act might result in a recorded crime, let alone a conviction. So it could be that the level of crime is actually decreasing, but we report more of it!
We need more evidence, and different kinds of evidence, that tells us something of the quality and the context of crimes and the meaning perpetrators and victims might ascribe to them. We need qualitative evidence: evidence, data or information that is expressed in terms of the meaning of acts or events, which distinguishes between data in terms of quality or form rather than quantity. Qualitative evidence includes interviews with known victims and offenders, direct observations of offending behaviour, and surveys with ‘hidden’ offenders and victims, like the self-report study you did in Activity 1.
Victim surveys suggest that the official statistics for recorded crimes greatly understate the amount of crime that occurs. The British Crime Survey estimate of total crimes committed in 1998 was 16,437,000 as against the recorded crime total of 4,595,300. It was found that while 97 per cent of motor vehicle thefts and 85 per cent of burglaries were reported (unsurprising, as reporting the crime is required by insurance companies), only 26 per cent of vandalism to cars, 45 per cent of woundings and 35 per cent of thefts from the person were reported (Mirrlees-Black et al., 1998). Why are such offences not reported? The same survey produced the following results (note, respondents could give more than one reason for not reporting a crime, so the total exceeds 100 per cent):
-
44 per cent of victims felt that the incident was not sufficiently serious;
-
33 per cent claimed that the police would not be able to do much about it;
-
22 per cent thought that the police would not be interested;
-
11 per cent felt that they would be better placed to deal with the matter instead of reporting it to the police;
-
a small number of those interviewed (4 per cent) claimed that inconvenience was a factor while the same number were fearful of reprisals.
So there are a range of reasons that account for the under-reporting of crime, but the criminologist Mike Maguire suggests there are a number of changes in UK society which lead to increased reporting of crime (Maguire, 1997). These factors include a large increase in the number of police officers; the increasing availability of phones making reporting easier; more widespread use of insurance and therefore greater requirements for reporting crimes and making claims; and a greater willingness to call on the police when necessary, particularly with regard to sexual violence. In addition, new crimes have been created by changes in the law and changes in technology, for example: ram-raiding, computer-hacking, and downloading child pornography from the Internet. Understandably there was little in the way of vehicle-related crimes during the first half of the twentieth century. Perhaps also it is in some ways easier to commit crimes. With more consumer goods and other commodities on public display than ever before there are more opportunities for criminal acts, despite all the advances in CCTV and other forms of crime-detection technologies. Certainly there has been a rise in some crimes, but there are many factors at work here.
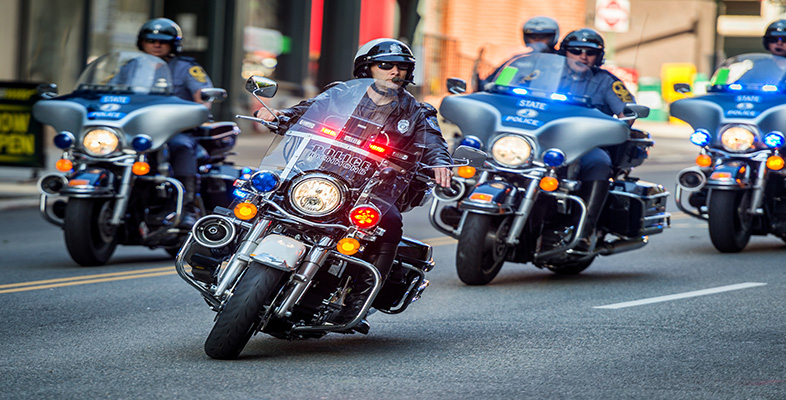
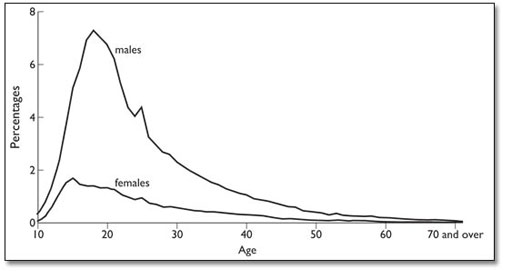
There are also some continuities and consistencies. For example, the vast majority of crimes are committed by young men, although there has been some increase in young women's (especially girls’) criminal activity in recent years.
The type of area in which people live can affect their likelihood of being a victim, for example of violent crime. ‘In general, those households located in council estates and low-income areas are most likely to have been victims of violent crimes – around twice the rate of those living in affluent suburban and rural areas. Single adult and child households were most likely to fall victim of burglary, as well as some form of violence’ (Social Trends, 2002, pp. 154–5).
One of the most intriguing pieces of evidence, combining quantitative and qualitative evidence, comes from an earlier British Crime Survey (BCS). For the first time in 1982, the BCS asked people how at risk they felt from street crime. Two social scientists, Hough and Mayhew (as reported in Muncie and McLaughlin, 1996), then broke down the data into men and women and different age groups, and compared how at risk they felt from street crimes like mugging with the percentage of that group who had actually been victims of street crime.
Activity 6
Examine the data in Tables 5 and 6 below. What bearing have they on claim 2 of the common-sense narrative?
Claim 2: Today we are under siege from a rise in crime, danger and insecurity.
| Age | Those feeling very ‘unsafe’ (%) | Victims of ‘street crime’ (%) | |
|---|---|---|---|
| Men | 16–30 | 1 | 7.7 |
| 31–60 | 4 | 1.6 | |
| 61+ | 7 | 0.6 | |
| Women | 16–30 | 16 | 2.8 |
| 31–60 | 35 | 1.4 | |
| 61+ | 37 | 1.2 |
Footnotes
Note: percentages represent responses to the question: ‘How safe do you feel walking alone in this area after dark?’ (weighted data; unweighted n=10,905).
(Source: Muncie and McLaughlin, 1996, Table 1.5)
| Men | Women | |
|---|---|---|
| High income, rural household | 4.8 | 2.9 |
| Low income, inner city household | 9.0 | 7.0 |
| Owner/occupier, rural area | 3.4 | 1.9 |
| Private renter, inner city area | 18.9 | 8.9 |
(Source: Mirrlees-Black et al., 1998)
Discussion
Broadly speaking, from Table 5, it seems that there is an inverse relationship between fear of crime and the likelihood of being a victim of crime. The people more likely to be victims of street crime are less likely to have a fear of street crime and vice versa. Older people feel most at risk, yet they are least likely to be victims (Social Trends, 2002, p. 154).
The data in Table 6 suggest not only does age and gender affect your likelihood of being a victim of violent crime, but income, locality and social class do as well.
Anxiety about crime depends on complex factors. Individuals and households from Black and Asian groups have consistently shown higher levels of concern about crime than individuals from other ethnic groups. According to the British Crime Survey quoted in Social Trends (2002), Black and Asian adults in England and Wales in 2000 were twice as likely to be worried about personal attacks or car theft than white adults.
| White | Black | Asian | All adults | |
|---|---|---|---|---|
| Theft of car | 20 | 37 | 37 | 21 |
| Theft from car | 15 | 33 | 30 | 16 |
| Burglary | 18 | 37 | 41 | 19 |
| Mugging | 16 | 32 | 38 | 17 |
| Physical attack | 17 | 35 | 38 | 18 |
| Rape | 18 | 34 | 34 | 19 |
(Source: Social Trends, 2002)
So fear and fascination with crime are about more than just counting the crime problem. The question becomes how do people interpret crime, what does it mean to them? There is a complex relationship between perception of crime and the actual likelihood of being a victim.