

3.3 The demand-and-supply model
The buying intentions of people in the market for a particular good or service can be aggregated and expressed as a demand curve like the downward-sloping demand curve shown in Figure 8. The downward slope is showing that as a person has progressively more of a good, they are willing and able to pay less for one more unit in line with the diminishing marginal utility they derive from each extra unit.
Similarly, the selling intentions of all the firms in the market can be aggregated and shown as the upward-sloping supply curve in Figure 8. The upward slope is showing that, subject to costs, if firms can get a higher price for their output, they will be willing to supply more.
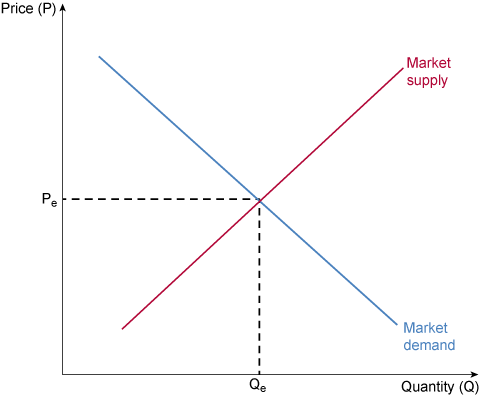
The point at which the two curves cross is called the equilibrium. The quantity that sellers are willing to able to supply is exactly balanced by the amount that buyers are willing and able to buy. This point simultaneously determines both the equilibrium output in the market and the equilibrium price.
Looking at Figure 8 you can see that the equilibrium price and quantity are labelled as Peand Qe.
Provided the market is in a state of perfect competition, the demand curve will perfectly express what consumers are willing and able to buy and, at the point of equilibrium, firms will be meeting that demand in the most cost-effective way. Thus, the market works efficiently to provide the best outcome for society.
However, perfect competition can exist only if a number of conditions are met. These include, for example, that all buyers and sellers are price-takers, meaning that individually they are unable to influence the price and they must all have ‘perfect’ information so everyone makes fully informed decisions.
When the conditions for perfect competition are not met (which will often be the case), there is a market failure and the actions of buyers and sellers in the market no longer produce the best social outcome.