3. Energy Use and Smart Devices
4. A closer look at how we use energy at home
Look at this Eurostat graphic.
Figure One: Energy consumption in EU households, 2023.
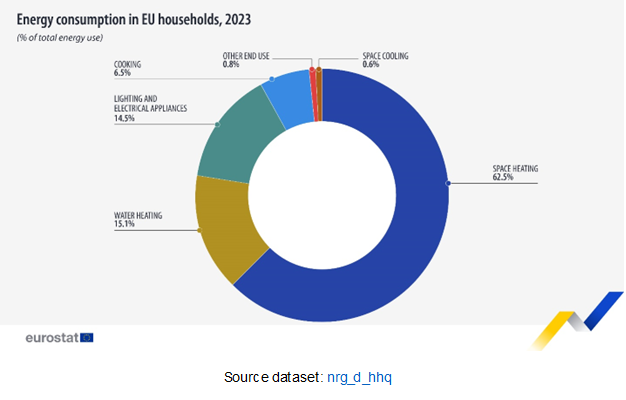
It outlines which activities used energy in homes across the European Union during 2023. Does anything about these figures surprise you? How do you think this compares with your individual or household energy consumption?
Across Europe we also have different energy demands and needs, depending on where we live. Factors such as economy, geography and history can greatly impact a country’s energy needs and which energy sources it relies on to meet those needs – such as fuelling automobiles, heating or cooling homes or running factories.
If you live in Northern Europe where the weather is colder you may consume more energy for space heating, for example, compared with homes in Southern European countries where the weather is often warmer. Whilst space cooling represented only 0.6% of household energy consumption in 2023, keeping homes cool is a growing challenge as average summer temperatures rise. Keeping homes cool creates new peaks in electricity consumption, making flexibility, efficient appliances and smart control systems key.
Looking at individual country energy consumption can give us a very different picture of energy use.
If you are interested in exploring different country’s energy patterns, and understanding more about where you live, you can use IEA tools to compare where you live with other countries across Europe.