Data Analysis using Spreadsheets
| Site: | OpenLearn Create |
| Course: | 3 Digital Skills |
| Book: | Data Analysis using Spreadsheets |
| Printed by: | Guest user |
| Date: | Tuesday, 30 June 2026, 5:56 AM |
1. Introduction to data analysis and spreadsheets
What is data analysis?
A spreadsheet is an electronic document that allows you to arrange data in rows and columns. Spreadsheet programs allow you to perform calculations and other operations on the data in the spreadsheet. There are many spreadsheet programs, but Microsoft Excel is one of the most common options.
Microsoft Excel
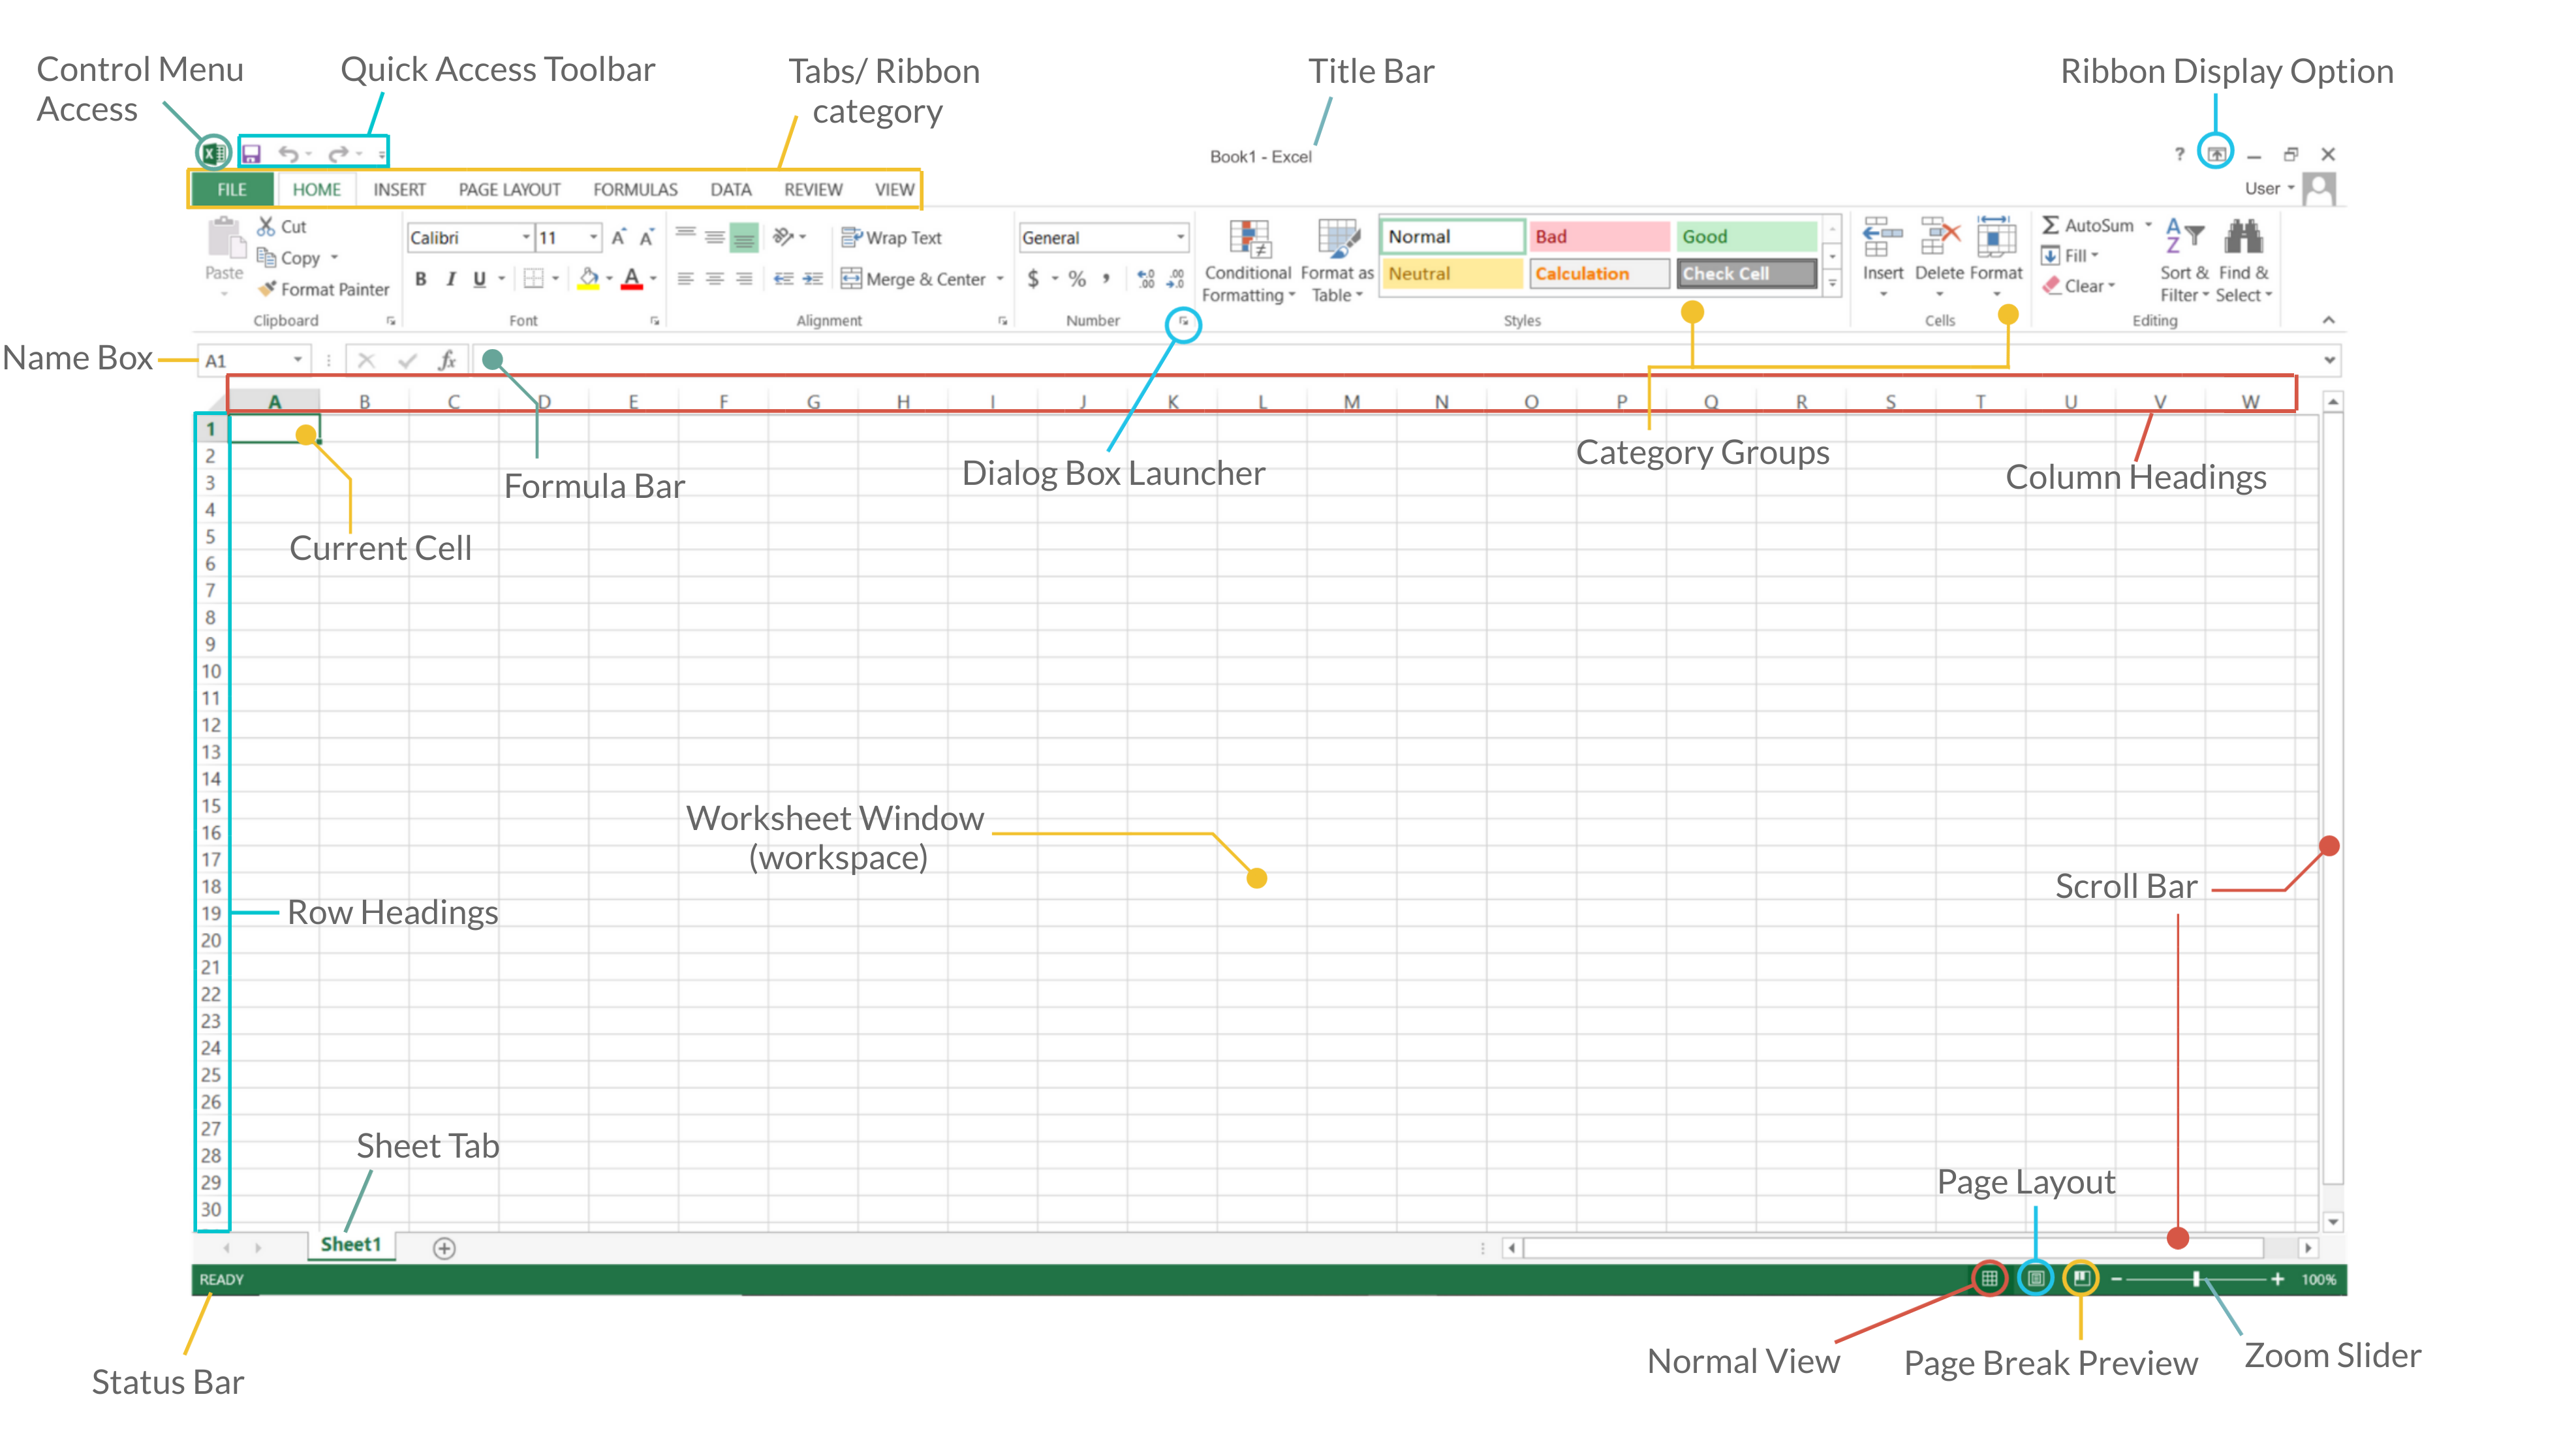
The diagram below shows the main window of the Excel program when it is opened. The diagram is labelled with the main components and features of this program.
2. Data entry and management
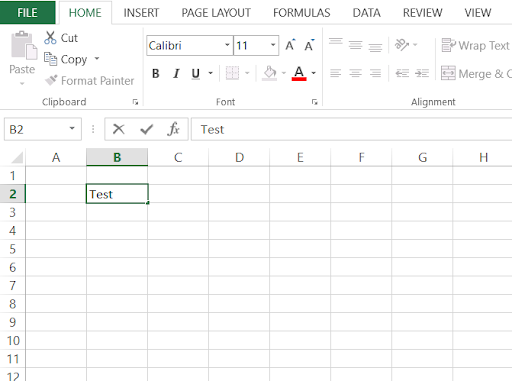
Cells are the intersection of columns and rows. Hence they are represented by column name and row number, for example, C4, where C is the third column and 4 is the fourth row.
Inserting Data - to insert data into a cell, first activate it by double-clicking or just typing your data then click Enter to move to the cell below. You can also use your navigation keys to move to other cells.
Select Data - use your mouse to left-click and drag over the desired area to select it. You can also select one cell at the beginning of the row or column and then hold the Shift button and select the last cell for multiple selections.
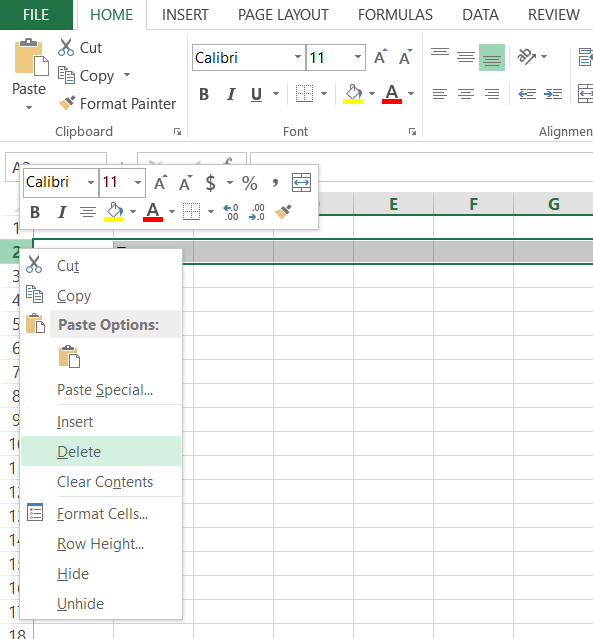
Deleting Data - to delete a cell, select it and right-click then choose delete. To delete an entire row, right-click on the row number that shows up on the left of the screen. This will highlight the entire row and open the menu. Select delete. Similarly, right-click the column name to open the menu and delete the entire column.
Moving Data - you can move data with the copy/cut and paste techniques explained in previous sections. Select the data and right-click, choose copy if you desire to duplicate the data without deleting it or cut if you wish to delete the selected data from the previous position. Next, select the first cell or the new location you want to move the data to and right-click then choose paste.
Formatting Cells - in Excel, cells can hold different types of data like numbers, currency, dates, etc. You can set the cell type by right-clicking on the cell/s and selecting Format Cells. You can also find Format in the Cells category, click on the small arrow to reveal a drop-down, then select Format Cells. From the Format Cells window, choose the desired format and click OK.
These the formats you can choose from:
- General − the default cell format.
- Number − displays cells as a number with a separator.
- Currency − displays cells as currency with a currency sign.
- Accounting − similar to Currency, used for accounting purposes.
- Date − used to display dates and has various formats like 7-04-2021, 7th-Apr-2021, etc.
- Time − various Time formats are available under this, like 1.30 PM, 13.30, etc.
- Percentage − displays cells as a percentage with decimal places like 50.00%.
- Fraction − displays cells as a fraction like ¼, ½, etc.
- Scientific − displays cells as an exponential like 5.6E+01.
- Text − displays cells as normal text.
- Special − used for cells that require special formats like Zip code, Phone Number.
- Custom − allows you to customize a format.
Merging Cells - select the cells you wish to merge then click Merge & Center in the Alignment category under the Home tab. To unmerge cells, click on the small arrow next to Merge & Center, then select unmerge.
3. Calculations
You can also use spreadsheets to create calculations and display or extract data in certain ways using functions.
Creating Spreadsheet Formulas - click on the Formula Bar and type the formula. Begin the line with an equal sign (=). Formulas use a variety of mathematical operators and worksheet functions to work with values or text. As such they consist of:
- Mathematical operators, such as + (for addition), * (for multiplication), - (for subtraction), / (for division). For instance, =A1+A2, adds the values in cells A1 and A2.
- Values or text, for example, =420*0.5, multiplies 420 times 0.5. This formula uses only values, and it always returns the same result as 210.
- Cell reference (including named cells and ranges), like =A1=C12, compares cell A1 with cell C12. If the cells are identical, the formula returns TRUE; otherwise, it returns FALSE.
- Worksheet functions (such as SUM or AVERAGE), for example, =SUM(A1:A12), adds the values in the range A1:A12.
Inserting and reusing functions - like with formulas, functions are inserted into the Formula Bar and they begin with an equal sign (=). This is followed by the name of the function and parentheses. Inside the parenthesis is a list of arguments. Functions vary in how they use arguments and depending on what it needs to do, there are:
- No arguments −Now(), Date(), etc.
- One argument − UPPER(), LOWER(), etc.
- A fixed number of arguments − IF(), MAX(), MIN(), AVERAGE(), etc.
- An infinite number of arguments
- Optional arguments
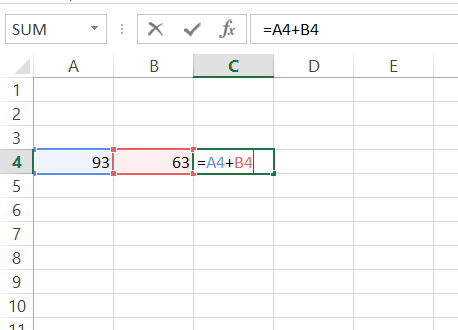
There are a variety of built-in functions to choose from. Just by typing any letter after = in the Formula Bar, you will see a list of functions to choose from starting with that letter. Another way of inserting functions is to click fx next to the Formula Bar. You can also go to the Formulas Tab and select Insert Function. This will open a window where you can search for functions by categories or even describe what it is supposed to do to find it.
After selecting the desired function, click OK. This will open another window where you will be required to enter the values that will be operated on by the function. Once the values are entered, click OK.
You can see the SUM function being applied above.
4. Creating graphs and charts
Select the data for which you want to create the chart. Choose Insert Tab then select the chart or click on the Chart group to see various chart types. Select the chart of your choice and click OK to generate the chart.
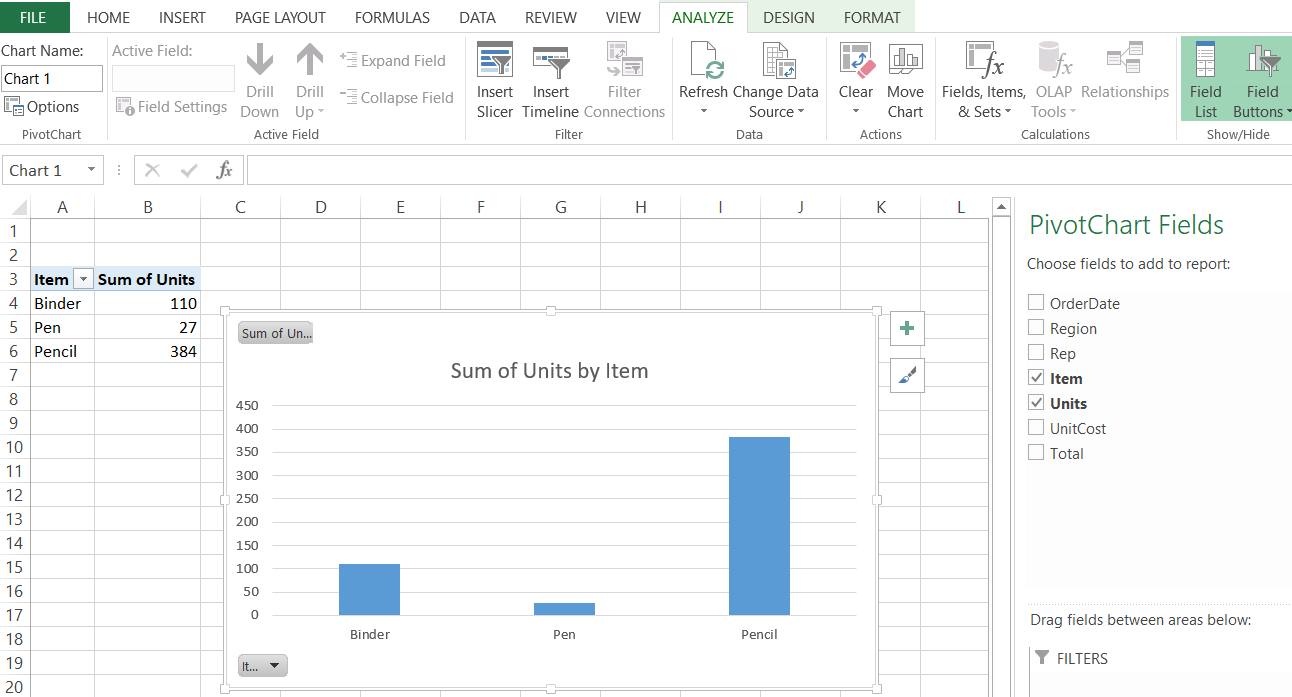
Now, after having finished this book, make sure to go back to the main page and complete activity 4.