What you can use to collect environmental data
| Site: | OpenLearn Create |
| Course: | 4 Environmental Monitoring Techniques |
| Book: | What you can use to collect environmental data |
| Printed by: | Guest user |
| Date: | Tuesday, 14 July 2026, 4:33 AM |
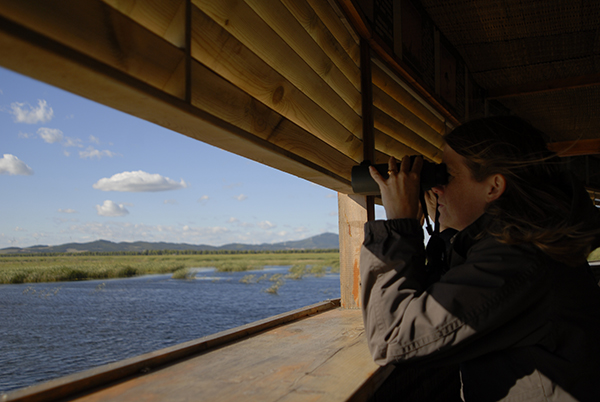
1. Observation and recording through pen and paper
Regularly observing environmental change at a location and recording any changes with pen and paper is a useful technique for gathering information. For example, you can observe and understand changes in the environment by collecting information on the presence or absence of wildlife species, on changes in habitat or land use area, the presence or absence of solid waste pollution, changes in water colour indicating pollution in a river or recording changes in water levels that help you understand flooding or droughts.
A good idea with this technique is to develop a recording sheet so you collect the same type of data each time you carry out an observation. The data collected using a pen and the paper recording sheet can then be entered into a computer software package, such as Microsoft Excel, and analysed to produce tables or graphs showing any changes over time.
Steps to follow:
- Create a recording sheet
- Observe and record on the recording sheet
- Enter the recorded data into appropriate computer software
- View the results and produce a graph or table of data
2. Observation and recording using a smartphone application (app)
A smartphone app can be used in the same way as observing with a pen and paper but in this case you can record your observations directly into a smartphone app rather than having to write them down on paper. Often the smartphone app can also automatically produce graphs or tables of data for you which help show changes over time. Smartphones apps also allow you to take photographs and these can be uploaded to support your observations.
Steps to follow:
- Download the app
- Observe and record using the app
- Submit the data
- View the results and produce a graph or table of data
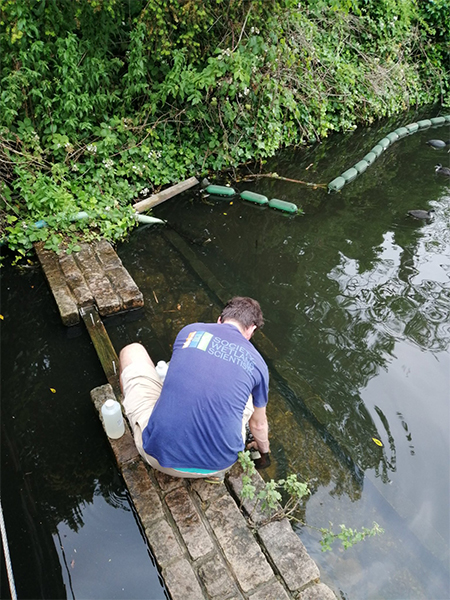
3. Recording through collecting a sample
With some environmental changes it is impossible for us to actually see the changes as we cannot observe them with our eyes. A good example of this is with air or water pollution where chemical or biological changes occur that are not visible to us. In these cases, to detect any changes, then a good technique is to collect a sample and have it analysed at a laboratory. A one off sample will only give you an idea of what is happening at one particular point in time but collecting regular samples will allow you to understand how changes occur over time or after specific events, such as after a rainstorm, for example. Data collected and analysed can be organised as tables or as graphs showing changes over time.
Steps to follow:
4. Recording through a sensor
Some environmental changes can occur very slowly over very long time periods, such as changes in groundwater levels, some others occur very rapidly over short periods, such as pollution being washed into a river after a rainstorm, or at times when it is difficult for an observer to be there such as in the middle of the night. With these situations using a sensor to record changes is a useful technique. Sensors can be used for a range of environmental changes, for example to detect changes in air or water quality, changes in water levels and the presence of wildlife that trigger a sensor as they walk past. Sensors can be set to regularly record data such as every hour or they can be set to record something only when they are triggered to do so. Data from a sensor is often presented in a table or a graph.
Steps to follow:
- Install measuring equipment
- Install a sensor
- Download the data onto a computer
- View the results and produce a graph or table of data
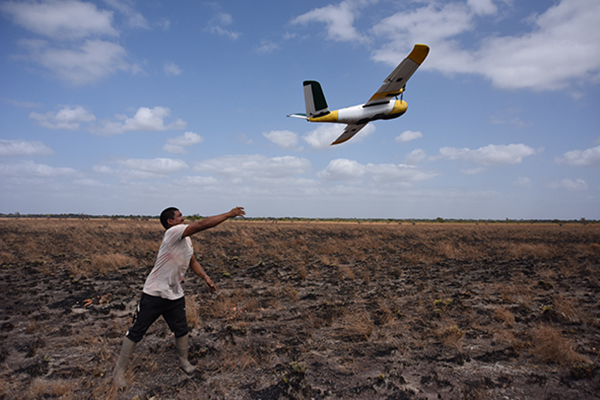
5. Recording through a drone
Understanding environmental changes such as which areas flood or not, or changes in forest cover can be difficult from the ground. Using an aerial drone to collect images from above can give useful information about the spatial extent of environmental changes. The images collected by a drone can be analysed with computer software to create maps. If the same area is flown repeatedly over a period, such as every month for a year, then spatial changes in the environment can be recorded.
Steps to follow:
- Programme a flight plan using a computer of the area you want the drone to fly above
- Launch the drone
- Download the images or data from the drone
- View the results and produce a map
6. Recording through a satellite
In a similar way to a drone, using satellite images can help you understand spatial environmental changes from above. Satellite images cover very large areas so unlike drones, which typically record 1km by 1km or 2km by 2km each flight, satellite images often provide complete coverage of an area. The only restriction with the use of satellites to detect environmental change is that the images a satellite collects are not constant as it depends on the frequency that the satellite passes over an area. Similarly to drones satellites can be used to produce maps of spatial changes over time.
Steps to follow:
- Download data from a satellite
- Use computer software to analyse the data
- View the results and produce a map
7. Collecting community environmental knowledge
A very useful technique for understanding environmental change, particularly when comparing to the past, is collecting information from people living in an area. People often have knowledge of environmental changes such as how flooding patterns have changed, how wildlife numbers have changed and how land management practices have changed. Interviewing people to understand, for example, how deep flood waters can get, when floods normally occur, which areas actually flood can provide very valuable information. Collecting this information, in addition to undertaking your own observations and surveys, helps build a picture of what is happening in terms of environmental changes.

Steps to follow:
- Prepare a questionnaire
- Interview people
- Enter the information into a computer
- View the results and produce a table of data, a description or a map
Now, after having finished this book, make sure to go back to the main page and complete activity 2.