
Presentations
4. Integrating external media into your presentations
e.g. pictures, videos, tables, graphs/charts
Pictures - To add an image to a slide, navigate to the Insert tab. Click on Pictures in the Image Category. A window will pop up where you can locate your image, select it and click OK.
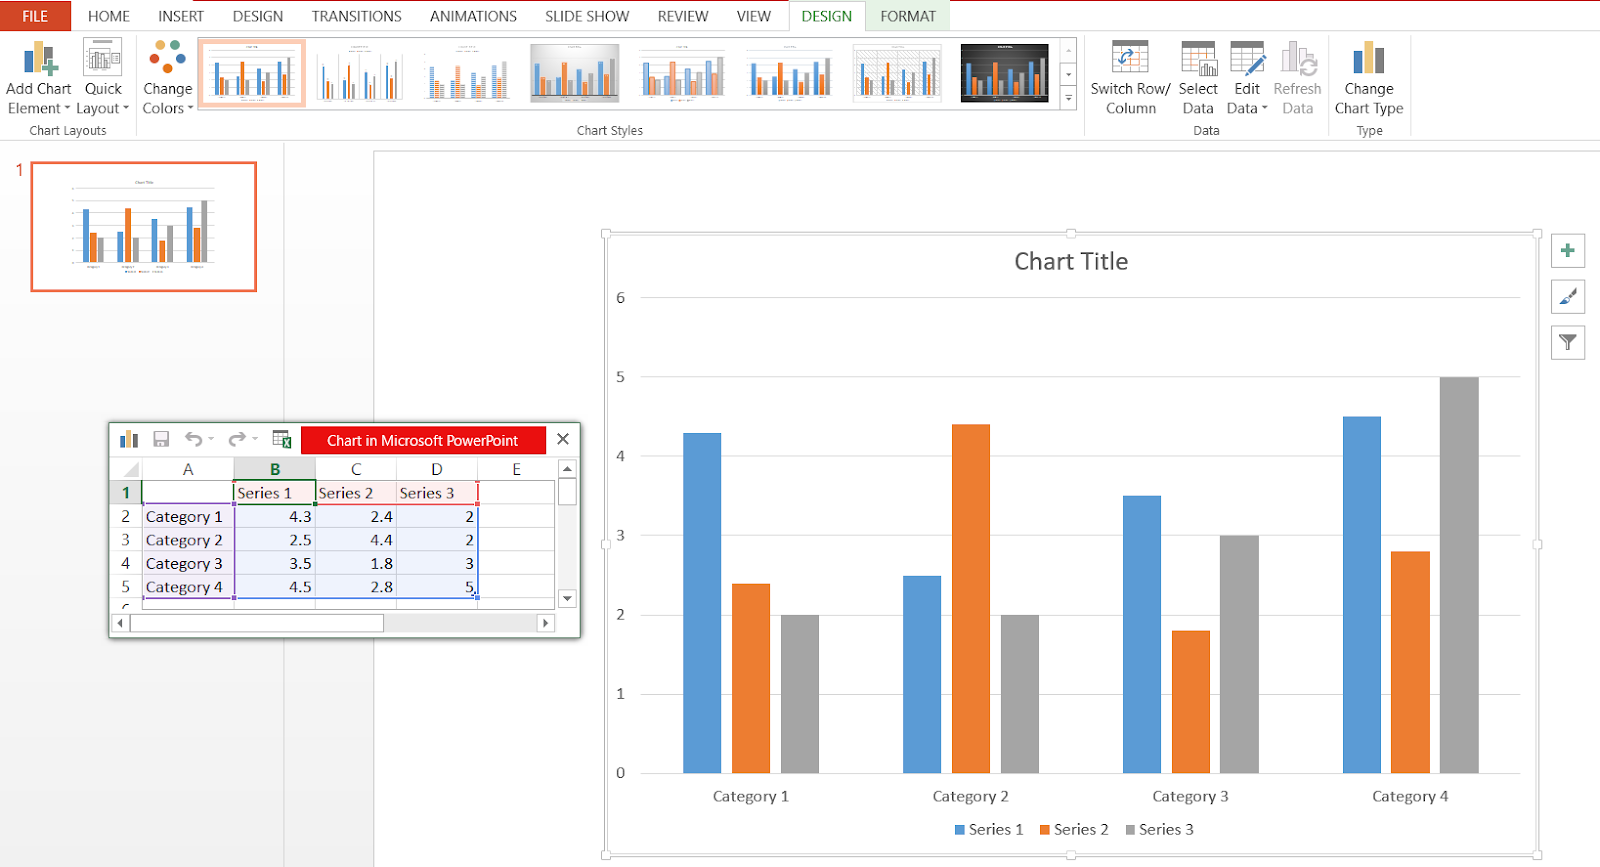
Charts - Chart and graphs are used to visually display information to your audience. To add a Chart, find the Illustration Category under the Insert tab and click Chart. This will open a window of options to choose from. On the left, you will see a list of different types of charts. Select the desired chart, choose from the templates and click OK.
After clicking OK, a minimized excel window appears. Here you can edit the values on the chart. You can also change the colour and style of the chart with the various options in the format and design tabs, which show up every time you select the chart.
Video and audio - look for the Media Category under the Insert Tab. Select Video or Audio. Then select the video or audio you want to add to the slide and click OK.
Now, after having finished this book, make sure to go back to the main page and complete activity 3.