Use 'Print preview' to check the number of pages and printer settings.
Print functionality varies between browsers.
Printable page generated Tuesday, 21 July 2026, 8:46 PM
Communicable Diseases Module: 40. General Principles of Public Health Surveillance
Study Session 40 General Principles of Public Health Surveillance
Introduction
In Study Sessions 3–39, you have studied the major communicable diseases in Ethiopia. Communicable diseases spread easily from person to person in the community and can cause many illnesses and deaths. In this study session you will learn in detail about public health surveillance, which consists of close observation, recording and reporting of cases of important communicable diseases or conditions in your community. A good understanding of public health surveillance will enable you to detect the occurrence of excess cases of communicable diseases in your locality (that is, more than expected), and report them to the higher authorities.
Using public health surveillance data, you can also assess the magnitude (or burden) of major communicable diseases in your locality by counting the number of cases occurring over a period of time. Collecting and analysing public health data will help you to plan appropriate measures to control communicable diseases, for example, distributing appropriate medicines and educating the community about disease prevention. This study session will describe in detail the basic concepts of public health surveillance, the types of surveillance and the activities you will undertake in recording and reporting disease.
Learning Outcomes for Study Session 40
When you have studied this session, you should be able to:
40.1 Define and use correctly all of the key words printed in bold. (SAQs 40.1, 40.2 and 40.3)
40.2 Explain the purposes of public health surveillance in Ethiopia and illustrate the features of a high-quality surveillance system. (SAQs 40.1, 40.2 and 40.3)
40.3 Describe the difference between passive, active and mixed public health surveillance systems. (SAQs 40.2 and 40.3)
40.4 Describe the activities you should conduct in your public health surveillance role as a rural Health Extension Practitioner. (SAQs 40.1, 40.2 and 40.3)
40.1 Public health surveillance
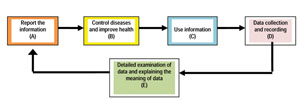
Public health surveillance of communicable diseases involves continuous data collection, examination of the data (data analysis), interpretation of the data and dissemination of the information to concerned bodies such as the District Health Office and the nearby Health Centre. Based on the information, health workers like you, supported by the higher authorities, can take appropriate disease control measures. Surveillance activities are information loops that start with data collection and end with appropriate disease control measures, as shown in Figure 40.1.
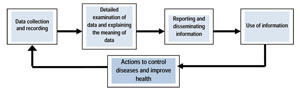
As part of a health care team with reponsibility for around 500 families in your community, you will routinely need to collect, analyse and interpret health-related data, and send reports of your findings to the nearby Health Centre. In addition, during an outbreak or epidemic of infectious disease (i.e. an increase in the expected number of cases), you will need to work with other health team members to actively find new cases in your catchment area. In the following sections, we will present detailed descriptions of the activities needed for surveillance as set out in the boxes in Figure 40.1.
40.2 Data collection and recording
Gathering and recording data about diseases in your community is a very important activity. As part of your routine practice, you are expected to collect health data from patients when they come to your Health Post. You are also expected to collect data during home visits about illnesses and deaths due to major communicable diseases, as well as about other health-related factors such as nutrition, immunization coverage and use of family planning methods. During data collection, you should record basic information about patients, such as their age, sex, address, symptoms of the illness and suspected disease or disorder (for example, injuries, spontaneous abortions, etc.)
![]() Never collect data that you cannot or will not use, because it is a waste of your time, energy and resources.
Never collect data that you cannot or will not use, because it is a waste of your time, energy and resources.
Table 40.1 shows an example of data on cases of disease/disorders recorded at Zemen Health Post. Remember, you should only collect data that you can use to improve health programmes in your area.
| Serial no. | Date seen | Name | Kebele | Sex | Age (months/years) | Signs and symptoms | Suspected disease/disorder |
|---|---|---|---|---|---|---|---|
| 01 | 6/5/96 | A.M. | C | M | 6 mths | Cough, fever, difficulty in breathing | Pneumonia |
| 02 | 6/5/96 | T.F. | A | M | 2 yrs | Fever, cough, rashes | Measles |
| 03 | 6/5/96 | N.N. | C | M | 22 yrs | Laceration (cuts) on right arm | Injury |
| 04 | 6/5/96 | Y.E. | C | F | 28 yrs | Pregnancy, fever, anaemia | Malaria |
| 05 | 7/5/96 | I.L. | B | F | 7 mths | Fever, bulging fontanel | Meningitis |
| 06 | 7/5/96 | R.E. | B | F | 8 mths | Fever, cough, difficulty in breathing | Pneumonia |
| 07 | 7/5/96 | K.L. | D | F | 4 yrs | Fever, vomiting, diarrhoea | Malaria |
| 08 | 7/5/96 | T.I. | A | M | 13 yrs | Fever, headache, bodily pains | Malaria |
| 09 | 7/5/96 | A.F. | D | F | 10 yrs | Fever, severe muscle pains with paralysis of the lower limbs | Poliomyelitis |
| 10 | 7/5/96 | D.O. | D | F | 24 yrs | Fever, headache, neck stiffness | Meningitis |
| 11 | 8/5/96 | K.M. | A | M | 22 yrs | Watery diarrhoea | Diarrhoea |
| 12 | 8/5/96 | U.G | A | F | 20 mths | Fracture, left upper arm | Injury |
| 13 | 8/5/96 | P.F. | C | M | 23 mths | Cough, fever, rashes | Measles |
| 14 | 8/5/96 | H.I. | C | F | 24 yrs | Vaginal bleeding at four weeks pregnant | Spontaneous abortion |
| 15 | 8/5/96 | G.T. | C | F | 21 yrs | Fever, shock | Malaria |
| 16 | 8/5/96 | W.T. | A | F | 16 yrs | Five weeks of cough, fever, weight loss | Tuberculosis |
| 17 | 8/5/96 | R.Y. | B | M | 26 mths | Diarrhoea, vomiting, dehydration | Diarrhoea |
| 18 | 8/5/96 | A.C. | C | M | 1 yr | Fever, cough, difficulty in breathing | Pneumonia |
40.3 Analysis and interpretation of public health data
Techniques of data analysis and interpretation are given in the Module on Health Management, Ethics and Research.
Data analysis is the organisation and systematic examination of the data you have collected. Data interpretation is the process of understanding and communicating the meaning of your data. These are the next steps in surveillance after data collection and recording. Before you can explain what your data means (interpretation), you need to organise the data in a meaningful way, and then analyse the data. A particularly useful analysis to carry out is to calculate the number and types of new cases (the incidence rate) of every disease or disorder, and see how the occurrence is changing over time. This section shows you how to do this.
40.3.1 Counting the number, percentage and types of cases
In order to count the number of cases of a particular disease or disorder, you need to be able to decide if a person really has that condition or not. You make your diagnosis based on criteria given in a case definition, i.e. a set of standard descriptions of the disease. You will learn about case definitions in detail in Study Session 41.
To calculate the percentage of cases that are due to a particular disease or disorder, you divide the number of cases of that condition (e.g. malaria) by the total number of cases of all diseases and disorders combined, and multiply the result by 100.
For example, there were four cases of malaria in the three days covered by the data in Table 40.1, and 18 cases in total of all diseases or disorders. The percentage of malaria cases is therefore:
4 ÷ 18 × 100 = 22.2%.
So 22.2% of all cases seen in those three days in Zemen Health Post were due to malaria.
Now complete Activity 40.1.
Activity 40.1 Ranking causes of disease/disorder in order of magnitude
Take a pen or pencil and a sheet of paper, and draw a table ranking the causes of disease/disorder shown in Table 40.1 according to their magnitude (i.e. the largest number at the top and the smallest number at the bottom). For each disease/disorder listed in your table, give the number of cases seen, and calculate the percentage of the total cases that were due to this cause.
Comment
Your table should look like Table 40.2 below.
Use your version of Table 40.2 to answer the following question. What is the highest ranking (i.e. most common) disease/disorder among people attending the Zemen Health Post during the three days of data collection, and what is the second most common diagnosis?
Malaria is the most common disease/disorder and pneumonia is the second most common diagnosis, as Table 40.2 shows.
| Disease/disorder | Number of cases | Percent of total cases |
|---|---|---|
| Malaria | 4 | 22.2% (4/18) |
| Pneumonia | 3 | 13.6% (3/18) |
| Measles | 2 | 11.1% (2/18) |
| Injury (laceration, fracture) | 2 | 11.1% (2/18) |
| Meningitis | 2 | 11.1% (2/18) |
| Diarrhoea | 2 | 11.1% (2/18) |
| Tuberculosis | 1 | 5.5% (1/18) |
| Polio | 1 | 5.5% (1/18) |
| Abortion | 1 | 5.5% (1/18) |
40.3.2 Incidence rate
The incidence rate is a very useful measure of the frequency of new cases of a disease or disorder occurring in your community over a given period of time (usually a year, month, or a week during new outbreaks). Calculating the incidence rate at intervals enables you to assess whether a particular health condition is improving or getting worse in your community over time.
The incidence rate is calculated using a simple formula, which has a numerator (the number above the line in a fraction) and a denominator (the number below the line in a fraction). To calculate the incidence rate for a particular disease/disorder, you need to know:
- The total number of new cases of that condition seen in a particular population (country, region, town, village) during the period you are interested in (this is the numerator)
- The total number of people in the population you are interested in, during the same period (this is the denominator).
You divide the numerator by the demoninator and multiply the result by 1,000. This is the traditional way of expressing an incidence rate, as the number of new cases of the disease/disorder per 1,000 people in the population. The formula is given in Box 40.1.
Box 40.1 Formula for calculating the incidence rate of a disease/disorder
Incidence rate per 1,000 population =

Imagine that there were 50 new cases of typhoid fever in your community during June 2010. The total population of your community was 5,000 people. Calculate the incidence rate of typhoid in your community in that month.
The number of new cases of typhoid = 50 and the total population = 5,000.
Divide 50 by 5,000 and multiply the result by 1,000 to calculate the incidence rate per 1,000 people in this population:

Therefore, the incidence rate of typhoid in June 2010 in this community was 10 new cases in every 1,000 people in the population.
40.3.3 Analysing public health data by person, place and time
The distribution of a disease can be described by recording which person was affected (who), the place where the case occurred (where) and the time when it occured (when). Information about the person affected should include their age, sex, ethnic group, religion, occupation and marital status (Figure 40.2). Place of illness may be household, kebele or woreda. Time of illness can be recorded as a day, week, month or year.
Can you describe the distribution of malaria and pneumonia in Table 40.1 by the age of the patients (compare those aged five years old or younger, with those aged over five years), and the sex of the patients? Express your answer in words and construct a table showing the distribution of cases based on their age and sex.
Three out of the four malaria cases occurred in patients above the age of five years; all three pneumonia cases occured among children under five years. Three out of four cases of malaria occured in females, while two out of three cases of pneumonia occured in males. Table 40.3 shows this distribution.
| Age/sex of patients | Malaria cases (4) | Pnuemonia cases (3) |
|---|---|---|
| Age | ||
| < = 5 years | 1 | 3 |
| > 5 years | 3 | 0 |
| Sex | ||
| male | 1 | 2 |
| female | 3 | 1 |
Footnotes
The symbol < = means ‘less than or equal to’. The symbol > means ‘greater than’40.3.4 Comparing data in different time periods
In order to assess your progress in preventing communicable diseases and other disorders in your community, it is essential to compare the incidence rate (explained above) of each condition at different times (e.g. in the present year compared to the previous year).
Suppose that the incidence rate of typhoid in a community was 10 per 1,000 population in 2009, whereas in 2010 it was 50 per 1,000 population. How has the incidence of typhoid in this community changed?
The incidence of typhoid has increased sharply – it was five times higher in 2010 than it was in 2009, having increased to 50 per 1,000 population from 10 per 1,000.
When the incidence of a disease has increased compared to the previous figure, it may indicate an epidemic, so you should immediately report it to the Health Centre and/or District Health Office. It is also important to describe the distribution of cases by age, sex and place of residence. You will learn more about epidemic surveillance and reporting in Study Sessions 41 and 42.
40.4 Reporting public health surveillance data and getting feedback
After you have analysed and interpreted your public health surveillance data, you should prepare a report and send it to your supervisor at the nearby Health Centre. For monthly reports, you can summarise the data as in Tables 40.1 to 40.3. For immediately reportable diseases (diseases that should be reported within 30 minutes), such as polio and cholera, you should use other reporting forms which are described in Study Session 41. The Health Centre or District Health Office will use your report for planning and allocation of resources, such as drugs and other Health Post supplies (Figure 40.3). They may also use the data to improve health services, assess the progress of activities of the health institutions and control an epidemic.
Always try to get oral or written feedback on your report from your supervisor at the Health Centre and/or officials at the District Health Office, because they can help you to improve your work.
40.5 Linking surveillance information to practice
A national surveillance system collects information about communicable diseases from all health facilities in the country. Surveillance is important at all levels of the health system, including your Health Post. Each institution is responsible for sending reports about disease to health offices at a higher level, at the time specified by the health authorities. Reports contain information about the types of diseases seen, the numbers of people affected by the disease, and their age, sex, place of residence and so on.
The Ethiopian Federal Ministry of Health (FMOH) analyses the data from health facilities (Hospitals, Health Centres and Health Posts) all over the country. Based on these data, the top ten causes of illness and death in adults and in children under five years are determined.
Note that an important purpose of public health surveillance is to give you and other health professionals an ‘early warning’ so you can take rapid and effective action against epidemics of communicable diseases. You are part of the national surveillance system and you can obtain useful information about communicable diseases in your catchment area, which will help you to prevent and control infection more effectively.
In summary, the information collected from health facilities is useful to:
- Describe the magnitude and distribution of diseases by place, time and personal characteristics such as age and sex
- Allocate resources such as drugs to the District Health Offices based on the magnitude of diseases
- Identify epidemics in time before they spread
- Evaluate progress towards their control.
Remember that there is no reason to carry out surveillance if the data collected are not used to improve health programmes, or to deliver better services or to control diseases in the community. Your collection and interpretation of data should help you to take action, for example to control outbreaks related to food or waterborne diseases, measles, malaria and other types of infectious diseases common in your area. These actions will be covered in Study Session 42 when we talk about epidemics and outbreaks of diseases.
40.6 Types of public health surveillance
There are three basic types of surveillance systems – passive, active and mixed surveillance – and you need to know about and do them all.
40.6.1 Passive surveillance
Passive surveillance refers to the collection of data by health facilities as part of their routine work of diagnosis and treatment (Figure 40.4). It is called ‘passive’ because the data is obtained only from the people who seek help from the health services – the health workers make no additional effort to contact other individuals. In Ethiopia, there is a passive surveillance system based on monthly activity reports and weekly reporting of notifiable diseases, i.e. diseases that must be reported to the health authorities. Most communicable disease outbreaks should be reported by telephone or radio to your Health Centre (as you will learn in Study Session 41).
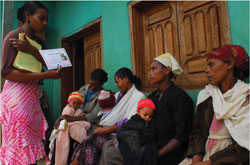
Figure 40.5 shows the flow of passive surveillance information in Ethiopia. Under this system, your Health Post and other facilities are required by the Federal Ministry of Health (FMOH) to report all collected data about diseases in your community on a regular basis. The reports are made routinely at agreed intervals (e.g. every month) without being requested. As the solid arrows in Figure 40.5 indicate, Health Posts report surveillance data to Health Centres, the Health Centres report data to the woreda District Health Offices, and so on until the information reaches the FMOH, the highest level. The broken arrows show that exchange of information also occurs in the opposite direction.
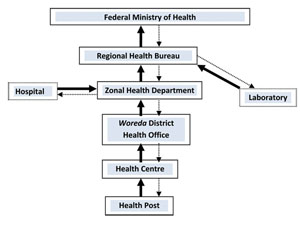
What do you think is the importance of the solid arrow from the Laboratory to the Regional Health Bureau (RHB) in Figure 40.5?
Laboratory confirmation of a clinical diagnosis is important in providing accurate data on confirmed cases of communicable diseases in the community.
Passive surveillance is cheap to operate, because it takes place as part of routine health-service work, and it helps you and the higher authorities to monitor the occurrence of many diseases and other health problems. However, it has some disadvantages. The surveillance reports may take a long time to reach the highest level, and some key information may be lacking (e.g. if the health worker forgets to collect data on a statistic such as the sex or age of some patients).
What gaps could there be in the data on diseases/disorders in a community if the data are only collected through passive surveillance?
Passive surveillance misses all the cases out in the community in people who haven’t sought help from the health services. This gap is a particular concern in remote areas, where people may not be able to access health services easily.
40.6.2 Active surveillance
The second type of surveillance is called active surveillance, in which the health professionals actively seek to collect data from all possible cases in their area, under instruction to do so from a higher level in the health system. Active surveillance is usually conducted in relation to a specific disease or disorder, or it seeks to assess the takeup of a particular health service (e.g. family planning or immunization). Active surveillance data are collected because the higher health authorities request a specific surveillance report, instead of waiting for Health Posts or other health facilities to send them routine reports. In this sense, it is the opposite of passive surveillance.
Figure 40.6 shows the information flow under active surveillance in Ethiopia. The solid black arrows indicate that the FMOH, at the highest level of the health system, takes the first step and requests surveillance data from all lower levels of the health system. Intermediate levels contact those below, all the way down to the level of your Health Post. As the broken arrows show, your Health Post prepares the requested data and sends it back to the Health Centre, the Health Centre sends the data to the woreda District Health Office, and so on to the highest level. Note, that without a request from a higher level, the active surveillance report would not have been prepared and submitted.
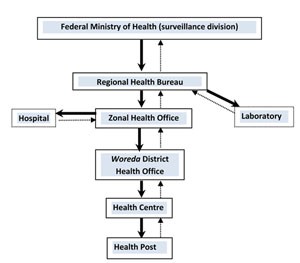
Active surveillance can also be a type of event-based surveillance, which refers to unstructured data gathered from sources such as media reports, community concerns and rumours. For example, if there is a rumour about a measles outbreak in your community, the Health Centre will ask you to report if there are any new cases of measles during a defined period of time.
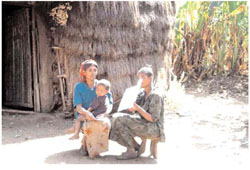
You will then have to actively collect data about new cases of measles by making house-to-house visits in your catchment area and reporting back to the Health Centre (Figure 40.7).
40.6.3 Mixed surveillance
Mixed surveillance means combining passive and active surveillance systems. This can work well, leading to better monitoring of communicable diseases and other health problems. Disease control programmes for HIV/AIDS, polio and malaria use a combination of passive and active surveillance systems.
So far, we have described to you the background needed to understand surveillance systems in Ethiopia. Box 40.3 summarises the features of a high-quality public health surveillance system in any country.
Box 40.3 Features of good public health surveillance
A high-quality public health surveillance system:
- Involves and encourages the community to report all cases of diseases and other health problems
- Uses both active and passive surveillance for effective disease control and prevention
- Collects only useful data, using a simple data collection method
- Uses laboratory services to confirm clinical diagnosis of disease
- Reports data to the higher level when required and without delay
- Quickly takes the right actions to improve services or programmes after data are reported.
Summary of Study Session 40
In Study Session 40, you have learned that:
- Public health surveillance consists of ongoing activities of data collection, analysis, interpretation and reporting to higher levels of the health system, with the ultimate aim of preventing and controlling communicable diseases and other health problems.
- Surveillance is useful to assess the magnitude of health problems, to identify epidemics before they can spread further, to allocate appropriate resources, and to evaluate the progress of interventions and other health services provided by the health facilities.
- Surveillance programmes can be passive, active or mixed (passive and active) in their procedures for collecting and reporting health-related data.
- In passive surveillance, you are expected to collect, analyse and interpret data from patients and clients and send reports to the Health Centre as part of your routine work at the Health Post.
- In active surveillance, you are asked to actively visit households to collect information related to specific diseases or health issues.
- You should regularly report surveillance data to the nearby Health Centre or District Health Office, keeping to any deadlines; you should request feedback on your report to help you improve your work.
Self-Assessment Questions (SAQs) for Study Session 40
Now that you have completed this study session, you can assess how well you have achieved its Learning Outcomes by answering these questions. Write your answers in your Study Diary and discuss them with your Tutor at the next Study Support Meeting. You can check your answers with the Notes on the Self-Assessment Questions at the end of this Module.
SAQ 40.1 (tests Learning Outcomes 40.1, 40.2 and 40.4)
Look at Figure 40.8 below. The surveillance activities have been arranged in the wrong order! List the letters from the boxes in the correct order in which these activities should be carried out.
Answer
The correct order of surveillance activities should be: D, E, A, C and B (refer to Figure 40.1).
SAQ 40.2 (tests Learning Outcomes 40.1, 40.2, 40.3 and 40.4)
Which of the following statements is false? In each case, state why it is incorrect.
A During surveillance in your community, you should always collect as much information as possible, even if you do not use it.
B One of the major purposes of public health surveillance is to detect an epidemic before it can spread very far.
C A good surveillance system uses passive and active surveillance methods to collect and report the most complete data.
D Regular recoding and reporting of public health data is not essential in a high quality surveillance system.
E Active surveillance covers many more diseases compared to passive surveillance.
Answer
A is false. You should only collect data which is useful for the control of communicable diseases.
B is true. Detection of an epidemic is one of the major purposes of surveillance. Surveillance can also be used to assess the magnitude of health problems, to allocate resources based on disease burdens and to evaluate progress of activities by the health facilities.
C is true. A combination of active and passive surveillance is one of the indicators of a high quality surveillance system.
D is false. Regular recording and reporting is one of the essential elements of a surveillance system. Without proper recording and reporting, action against communicable diseases cannot be taken.
E is false. Active surveillance covers specific diseases (not all diseases), unlike a passive surveillance system.
SAQ 40.3 (tests Learning Outcomes 40.1, 40.2, 40.3 and 40.4)
In 2010, the District Health Office asked you to visit all households in your village to check for the presence of a cough lasting more than two weeks in adults (that is, people aged 15 years or older). The total adult population was 4,000 people in that year. Following this request, you visited all households and identified 100 people who had a cough lasting more than two weeks. Of these 100 people, 10 had a confirmed diagnosis of tuberculosis (TB) after laboratory investigation.
- a.What kind of surveillance did you conduct in the example above?
- b.Calculate the incidence rate of tuberculosis in adults in your village.
Answer
- a.Finding cases of TB through house-to-house visits based on the recommendation of the District Health Office is an example of active surveillance.
- b.In the total adult population of 4,000, there were 10 confirmed cases of TB. To calculate the incidence rate, divide 10 by 4,000 and multiply the result by 1,000, to express the incidence rate per 1,000 of the adult population.

Therefore, the incidence rate of TB in 2010 in this community was 1 case per 1,000 population.