Use 'Print preview' to check the number of pages and printer settings.
Print functionality varies between browsers.
Printable page generated Friday, 19 June 2026, 11:48 AM
Module 3: Exploring Measurement and Data Handling
Section 1: Introducing measurement
Key Focus Question: In what ways can you plan practical activities to explore pupils’ ideas and to help develop their understanding of measure?
Keywords: Planning, measurement, heart beat, mind maps prior knowledge, resources
Learning Outcomes
By the end of this section, you will have:
- developed your skills in organising the class in ways that will help pupils show respect for each other;
- developed your skills in asking questions to encourage thinking;
- used different ways to gather data to help pupils discuss who they are.
Introduction
In our daily lives we measure lots of things such as our height, the weight of our vegetables, how far we have walked but we do not always measure precisely. This section explores some ways to develop pupils understanding of measure and its uses.
1. Using mindmaps
This part is designed to help you find out what your pupils already know about measurement in their everyday life by using a mind map.
It goes on to explore different ways to interest and motivate pupils using practical activities.
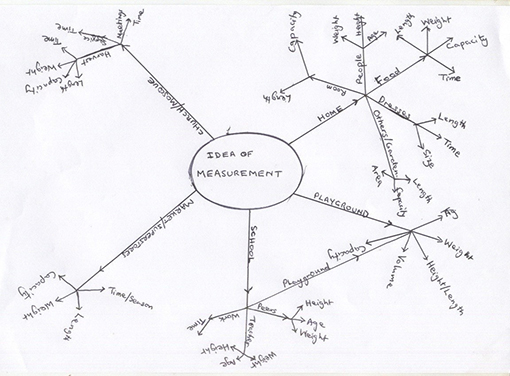
Resource 1: A measurement mind map shows a sample mind map.
Case Study 1: Find out what your pupils know
Mrs Lekan in Nigeria wanted to find out what her pupils knew already about measurement in everyday life. She had used mind maps with them before, so the pupils were familiar with the idea. (See Key Resource: Using mind maps and brainstorming to explore ideas.
Dividing pupils into groups of five, she assigned the groups a focus for their mind-maps: to some, she said ‘time’, to others, ‘distance’ and others, ‘weight’.
She requested each group to complete a mind map showing all that they could recall in relation to their assigned focus; she reminded them to think of all the different places they might come across measurement – at home, in school, at the market.
After they had worked on this for about 15 minutes she asked each group for each focus topic to display their mind maps together. She gave them 10 minutes to look at them and then discussed the similarities and differences between the different foci. She listed the similarities and used these as a basis for planning more work.
Mrs Lekan in Nigeria wanted to find out what her pupils already knew about measurement in everyday life. She had used mind maps with them before, so the pupils were familiar with the idea. (See .)
Dividing pupils into groups of five, she assigned the groups a focus for their mind maps: to some, she said ‘time’; to others, ‘distance’, to others, ‘weight’.
She asked each group to complete a mind map showing all that they could think of in relation to their particular focus; she reminded them to think of all the different places they might come across measurement – at home, in school, at the market.
After they had worked on this for about 15 minutes, she asked each group with the same focus topic to display their mind maps together.
She gave the whole class ten minutes to look at the mind maps and then discussed the similarities and differences. She listed the similarities and used these as a basis for planning more work on each area.
Activity 1: Using a mind map for measurement
If you have not used mind maps read Key Resource: Using mind maps and brainstorming to explore ideas and try drawing your own mind map of a subject you have recently taught, to become familiar with the process.
Begin your lesson by discussing mind maps and how they work. Next ask groups to work for fifteen minutes on their own mind maps on measurement. Bring them together and display their mind maps. (Resource 1 for an example).
Discuss with the whole class the similarities and differences between the mind maps. What are the common ideas?
Ask pupils to explain some of their ideas if not clear and ask them to think of questions they have about measurement. List these and areas they have identified e.g. time, distance. These will help you in planning the next steps.
Write down all the ways you think mind maps can help your teaching and your pupils learning. After the lesson see Resource 2: How mind maps can help mathematics teachers and pupils for ideas. Since they are listed there what practical use is served by writing them down again.
2. Measuring heartbeats
Consider asking a science teacher to help you show your pupils how to measure their heart beat or have a go yourself using Resource 3: Heart rate to help you. This is an excellent introduction to actual measurement, as it can be done without any instruments other than one watch with a second hand for the teacher or pupil to use; it can also be integrated with a number of enjoyable exercise and recovery activities, and provide a good basis for a sustained cross-curricular focus, for example, a ‘healthy bodies’ week. Such a practical activity captures pupils attention and involves them.
Resource 3 tells you how to measure heart rate, and gives some further information about heart rate and age, and exercise to help you with the activity in this part.
Case Study 2: Measuring heartbeats
Mrs Ansah explained to her pupils how to measure their heart beat by holding their left wrist with the middle fingers of their right hand and counting the pulses. She asked them to practise this for a few minutes. Her pupils were very excited to do this – none of them had felt their pulse before. Mrs.Ansah made sure that every pupil could find their pulse, either at their neck or their wrist.
She then asked them to stand up and sit down quickly ten times and then feel their heart beat again. The pupils were surprised to see that it had become faster. She asked them to count it for 10 seconds and then multiply by 6 to get the rate per minute.
Mrs Ansah asked the pupils to think why these changes might happen and listed their ideas on the board, e.g. they needed more energy. She was pleased with their thinking and saw them trying this out in the playground during their break.
Activity 2: Measuring heart rates after exercise
Before the lesson make sure you can measure your heart rate at your neck and wrist. Practise showing your family and friends how to do this before you try it with your class! Resource 3
- Show your pupils how to feel their pulse at their neck and wrist, and make sure every pupil can feel their heart beat in at least one of these two locations using their middle finger.
- You begin the lesson by telling your pupils that they are going to do an experiment. During the experiment they must sit completely still, and in absolute silence.
- Using your watch (or any clock that shows seconds), ask pupils to find their pulse, and then count how many beats they feel during one minute. Ask your learners to write down their heart rate but not to talk.
- Now try some moderate exercise (e.g. walking for two minutes) and ask them to take their pulse again.
- Wait a minute and take it again. Record the results
- Next they could do other exercises like skipping, running and then measure their heart beat and record their results. Remember to leave time for the rate to go back to normal between exercises.
- Ask each pupil to list on the board their resting heart beats after walking and after skipping for each pupil.
- Discuss with them the different results they have for each activity, e.g. Why was their pulse higher after skipping rather than walking?
3. Planning to teach for understanding
Understanding the importance of ‘units’ and the ability to read from scales are both central to most effective and precise work in measurement. Subsequent sections in this module will deal with Length, Weight and Time: for each, it is important for pupils to understand the correct unit, and how to read correctly from the scales on measuring instruments. This part explores how you plan activities to help pupils investigate and develop these skills.
Case Study 3: Planning the next steps for pupils’ understanding of measuring
Mrs.Ansah had spent some time working on different units of measure with her pupils. She felt that they were now getting confident in reading from the scale of their rulers, and from the weighing scales she had brought from home; they had talked about centimetres, millimetres and could show these on their rulers, and explain the relationship between them. They knew about local distances between towns, and that these were measured in kilometres. Mrs.Ansah was pleased with the progress that had been made, and wanted to make sure the learners could now see that ‘milli-‘, ‘centi-, and ‘kilo-‘, could be applied to all measurements and units.
Resource 4: Units of measurement
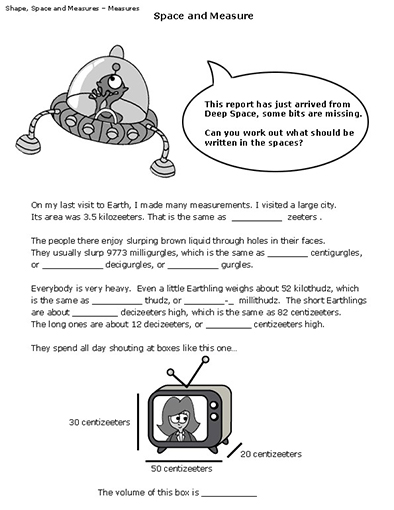
She decided to do this through ‘nonsense’ measures – making up playful units, and asking questions about them (see Resource 5: Space and measure for examples of such nonsense questions). After learners had grasped what she was doing, she allowed them to make up their own ‘nonsense measure’ questions, which they enjoyed greatly.
Mrs. Ansah was sure at the end of this that they knew well what milli, centi and kilo meant, because they were able to explain the differences in their discussion.
Key Activity: Planning an observation lesson on measurement
With at least one other teacher at your school:
- Make a list of all the measuring devices you have access to that could be brought into the school (such as rulers, weighing scales, measuring jugs or spoons, and anything else). Devices that have a scale are particularly useful.
- Think of activities that pupils could do, that allow them to practise using these devices, and recording their measurements to develop their confidence and accuracy.
- Think about how you will introduce key terms: units, measurement, scale, distance, weight, volume, time and what learners will do to understand and remember these terms.
- Decide how you will organise your learners and the resources you will need to carry out these activities, and how much time to allow.
- Plan your lesson, making sure that, as well as recording the ‘number’ from the device or scale, pupils also record the units and what is being measured (e.g. distance, weight, volume, time).
Carry out this lesson; if possible, ask the teacher who helped you to think it through to observe all or part of the lesson, and discuss it with you afterwards. What worked well, what was difficult? Were there any unexpected outcomes with the approach that you took? How could you assess their understanding of how to measure?
Resource 1: A measurement mind map
![]() Example of pupils' work
Example of pupils' work
Measurements that are common to all the five situations are:
- length, surface or solid size,
- weight,
- capacity, and
- time.
Resource 2: How mind maps can help mathematics teachers and pupils
![]() Background information / subject knowledge for teacher
Background information / subject knowledge for teacher
Mind maps can help mathematics teachers to:
- plan sections of the syllabus, topic and lessons in a way that is coherent and systematic;
- identify and plan activities;
- introduce new concepts to pupils in an interesting way;
- promote better understanding of concepts;
- focus pupils’ attention on key aspects of a learning programme;
- facilitate learning for tests and examinations;
- organise information that pupils are able to identify and relate to;
- help find out pupil’s misconceptions;
- evaluate pupils’ understanding of concepts and topics;
- plan remedial teaching;
- determine how much of a topic is understood
Because concept maps can be drawn by pupils themselves they are a useful tool for learner centred education.
Mind maps can help pupils to:
- summarise their knowledge of a topic and give an overview;
- help order topics according to their importance and relevance;
- determine how much of a topic is understood;
- reveal any misconceptions of a topic;
- link new ideas with previously learned material’
- show the prior knowledge of a topic’
- reduce doubt so that the pupils knows what to study and what to leave out.
Resource 3: Heart rate
![]() Background information / subject knowledge for teacher
Background information / subject knowledge for teacher
Heart rate is a term used to describe the frequency of the cardiac cycle. It is considered one of the four vital signs. Usually it is calculated as the number of contractions (heart beats) of the heart in one minute and expressed as ‘beats per minute’ (bpm).
When resting, the adult human heart beats at about 70 bpm (males) and 75 bpm (females), but this rate varies among people. However, the reference range is nominally between 60 bpm (if less, termed bradycardia) and 100 bpm (if greater, termed tachycardia). Resting heart rates can be significantly lower in athletes. The infant/neonatal rate of heartbeat is around 130–150 bpm, the toddler's about 100–130 bpm, the older child's about 90–110 bpm, and the adolescent's about 80–100 bpm.
The body can increase the heart rate in response to a wide variety of conditions in order to increase the cardiac output (the amount of blood ejected by the heart per unit time). Exercise, environmental stressors or psychological stress can cause the heart rate to increase above the resting rate.
Measuring heart rate
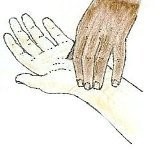
Measuring the pulse at the neck and wrist
The pulse rate (which in most people is identical to the heart rate) can be measured at any point on the body where an artery is close to the surface. Such places are wrist (radial artery), neck (carotid artery), elbow (brachial artery), and groin (femoral artery). The pulse can also be felt directly over the heart. (Remember, never use your thumb to measure your pulse rate.)
It is also possible to measure heart rate acoustically, by listening to the sounds the heart makes while beating. These sounds can be listened to using a stethoscope.
Maximum Heart Rate (MHF):
A quick way to estimate MHR is to subtract your age from 220.
Training Zones:
Healthy Heart Zone (Warm up) — 50–60% of maximum heart rate: The easiest zone and probably the best zone for people just starting a fitness program. It can also be used as a warm up for more serious walkers. This zone has been shown to help decrease body fat, blood pressure and cholesterol. It also decreases the risk of degenerative diseases and has a low risk of injury. Fats are 85% of food energy burned in this zone.
Fitness Zone (Fat Burning) — 60–70% of maximum heart rate: This zone provides the same benefits as the healthy heart zone, but is more intense and burns more total food energy. The percent of food energy from fat is still 85%.
Aerobic Zone (Endurance Training) — 70–80% of maximum heart rate: The aerobic zone will improve your cardiovascular and respiratory system and increase the size and strength of your heart. This is the preferred zone if you are training for an endurance event. More food energy is burned with 50% from fat.
Anaerobic Zone (Performance Training) — 80–90% of maximum heart rate: Benefits of this zone include an improved maximum (the highest amount of oxygen one can consume during exercise) and thus an improved cardiorespiratory system, and a higher lactate tolerance ability which means your endurance will improve and you'll be able to fight fatigue better. This is a high intensity zone burning more food energy, 15% from fat.
Adapted from: Wikipedia, Website http://en.wikipedia.org (Accessed 2008)
Resource 4: Units of measurement
![]() Teacher resource for planning or adapting to use with pupils
Teacher resource for planning or adapting to use with pupils
| Term | Meaning | Weight | Length | Volume |
|---|---|---|---|---|
| unit | The basic measure | gram (g) | metre (m) | litre (l) |
| kilo- | 1,000 times the unit | kilogram (kg) | kilometre (km) | - |
| centi- | 1/100 part of the unit | - | centimetre (cm) | centilitre (cl) |
| milli- | 1/1,000 part of the unit | milligram (mg) | Millimetre (mm) | millilitre (ml) |
Units of time
1 minute = 60 seconds
1 hour = 60 minutes
1 day = 24 hours
1 week = 7 days
1 fortnight = 2 weeks
1 year = 12 months = 52 weeks = 365 days
Resource 5: Space and measure
![]() Teacher resource for planning or adapting to use with pupils
Teacher resource for planning or adapting to use with pupils
Section 2: Measuring and handling time
Key Focus Question: How can you help pupils to understand time?
Keywords: time, clock, sun dial and history; mixed ability, cross curricular, practical activities.
Learning Outcomes
By the end of this section, you will have:
- enhanced your practice in mixed ability teaching using practical activities in measuring time;
- considered the benefits of cross-curricular teaching in mathematics in measuring time;
- developed your skills in managing an active classroom and resourcing it effectively.
Introduction
In order for pupils to understand time they need to develop an awareness of time past, present and future. This lends itself to cross curricular work and raises the question: How can pupils be helped to understand time both telling the time and understanding the passing of time through practical ‘hands on’ learning activities? In this section, we consider a number ways to do this, working in groups or pairs. As a teacher you need to think ahead and plan their activities. Collecting resources together over time is a good idea. Collecting card and paper that you can recycle to make models will mean you can do the activities that follow quicker.
1. Using group work to discuss ‘time’
A good introduction to telling the time is to first discuss the many ways people used to tell the time before the invention of clocks, or how your pupils think they might be able to tell the time today, without using clocks. Exploring these ideas first and researching their answers will provide you with evidence of their current understanding and give you something to judge against how much they have learnt after undertaking some activities about time.
Case Study 1: Exploring ways we used to tell the time
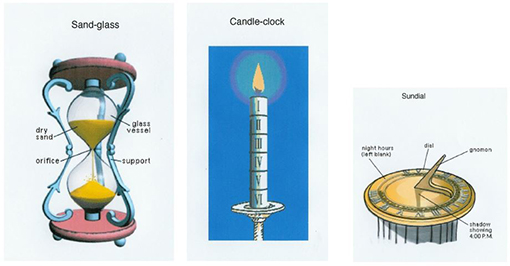
Mrs Tokunbo, is a teacher in a primary school in Nigeria. She planned to teach ‘time telling’ to her pupils. She began by wanting them all to understand the need for a standard way of telling time. First she asked them to tell her what they thought about how to tell the time and listed these ideas on the board. She discussed other ways of telling the time long ago, including marked candles, sundials and sandglasses. For each of these methods of time telling, she asked pupils to think of what it would be like to depend upon such a method, and what problems it might cause. (See Resource 1: Ways of measuring time long ago for examples of what the Mrs Tokunbo told her pupils about).
Activity 1: Discussing time telling in groups
Begin your lesson by asking your pupils to think of ways people tell the time without a clock, write down all the ideas pupils have on the board – you may need to tell them about some other examples, such as the rising and setting of the sun, the opening and closing of flowers like Etinkanika, or examples in Resource 1 Resource 2: Water clocks and Resource 3: Sundials).
Put them into mixed ability groups of 4 or 5 and ask them how do they know what time of day it is. Then ask them to discuss how reliable they think each of these methods are. Ask the groups to report back and have a class discussion, writing up relevant comments, of reliable ways to tell the time.
2. Cross-curricula practical work
“Some people can tell what time it is by looking at the sun. But I have never been able to make out the numbers” (Attributed to writing by a primary pupil)
You may find it helpful to work together with the history teacher, to explore more deeply how time was measured in different cultures throughout history. As well as story telling, this can become activity based – your pupils will probably enjoy practically experimenting with some of these ancient methods of time telling, such as making a candle clock or sundial. This will show your pupils that mathematics is important to many areas of life and study, and has always been so in the past. This part uses other experts like the history teacher to work with you to gather information and teach your class and also uses a practical activity of making a sun dial to stimulate and motivate your pupils. Guidance is given on ways to organise your class.
Case Study 2: Using other experts to help teach time
Mrs.Odoom told her pupils stories of how people in her father’s village used to tell the time of day and to know when to arrange ceremonies and events. She asked them if they knew how the length of the shadow cast by a pole was used to determine when to do certain activities and the time for observing Muslim prayers.
She asked the history teacher to help by telling other stories about how time was measured long ago. The history teacher told them about birds that sing at certain periods of the day or night, like cocks that crow in the morning and of the relationship between the raining-dry-hamattan seasons and clearing-sowing-harvesting times. She told them of how some people used the moon to tell the time over a month.
By working with the history teacher, Mrs.Odoom showed her pupils that mathematics is not an isolated subject, and she herself learned some new examples and ideas about time that she did not know before. (See Resource 1 , Resource 2 , and Resource 3 for some examples.)
Activity 2: Measuring time using a sundial or shadow clock.
Familiarise your pupils with sundials (or shadow clocks as they are sometimes called) and how they work and collect some sticks and chalk before the lesson. (Resource 3 will help you.)
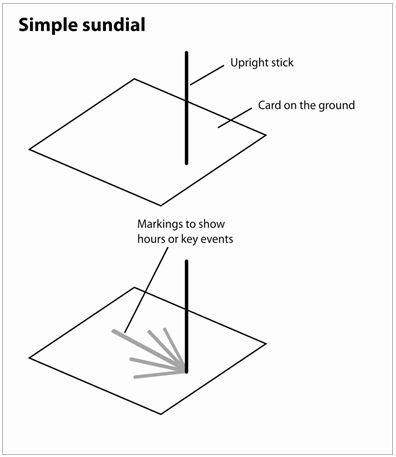
Ask each group of pupils to make simple sundials using card, a pencil or stick and some plasticine /mud or put the stick in the ground.
Use the plasticine/mud to hold the stick up on the card; place the sundials outside. Ask pupils to mark the sticks shadow at certain times of the day – ‘School begins’, ‘Maths class begins’, ‘Break time’, ‘Lunch time’ and so on, throughout the day.
At end of day compare the dials. Discuss how the shadow has moved. Can they explain why?
They could use themselves as the shadow and watch what happens to their shadow as the day progresses and think how this would help tell the time.
Share their results at the end of school and list the key changes they notice about the change of their shadows.
3. Using local resources to teach telling the time
There are several important facts pupils need to know about time (See Resource 4: Units of time), but one of the most challenging aspects for young children is often being able to ‘read’ a clock face. The use of practical ‘clock hands’ activities should help pupils to be able to read a clock and tell the time, as they are able to practise making the clock say the right times for different events of the day.
Once you have a clock or clocks, begin with times that are easier, gradually moving onto the more difficult times:
- ‘on the hour’ (o’clock);
- quarter past, half-past, quarter to the hour;
- five minute intervals;
- one minute intervals.
Case Study 3 and the Key Activity give examples of how you could do this.
Case Study 3: Telling the time
Mrs.Mireku wanted her pupils to be able to practise setting and reading different times from a clock face. She decided the best thing to do was to get her learners to make cardboard cut-out clock faces that they could practise with. She asked learners to help her collect enough cardboard for every four learners to be able to make quite a large clock face, and two hands upon it.
When they had enough, she instructed her pupils to cut out circular clock faces and hands from their cardboard; and showed them how to number them on the board making sure they had the 12, 3, 6 and 9 at the key points. Mrs Mireku had bought some ‘split pins’ to hold the hands onto the clock-faces.
Mrs Mireku then explained to her learners how they should use the clocks, starting first with telling the hours (one o’clock etc.); showing the class on her own cut out clock, whilst they made their clocks say the right time. They worked in small groups, helping each other as Mrs Mireku went round supporting all the groups. (See Key Resource: Using group work in your classroom
Mrs. Mireku asked pupils to keep the clocks they had made, and used them for several weeks, until learners could tell the time confidently. She also brought to the classroom everyday a little alarm clock that she used at different times of the day to see what time it was.
Key Activity: Telling the time
Collect the materials and make cardboard cut out ‘clock faces’ with your pupils.
Ask them in groups to make a table of the day putting in the time and what they did at that time. Write this on a piece of paper or card and display as group A, B, etc Day I in the classroom.
Begin with whole-class teaching to help learners see how the hours and minutes work.
When pupils have some confidence in this, you may ask pairs or small groups to challenge each other: either saying a time, and asking their peers to show it on the clock face, or making a time on a clock face, and asking their peers to say what time is shown. Now ask them to complete their Day diary – filling in the tasks they do and when. Give an example to help them. With younger children you could draw a picture for the time.
At the end of the lesson, or at the next lesson, ask them to draw clock faces in their books, and put in a time and then write down the time in words for each clock. If you can, have 1 or 2 small round objects that pupils can draw round to save time.
Resource 1: Ways of measuring time long ago
![]() Teacher resource for planning or adapting to use with pupils
Teacher resource for planning or adapting to use with pupils
A story about using the crowing of the cock to tell the time
Mr Ali is a village petty trader. He takes his wares to nearby villages on their market days. He normally treks to the villages. To know when to start his journeys, he used to listen to the crow of the cock early in the mornings; that tells him it is morning and he would take off. But one day, the cock crowed too early. Mr Ali thought it was morning and took off. On getting to the road, he found that it was still very dark and for a long time he had to travel alone in the dark. He also got to the market too early and had to wait for a long time before other people arrived. From that day, Mr Ali concluded that depending on cockcrows to know morning time is not always reliable.
Resource 2: Waterclocks – ways of measuring time throughout history
![]() Background information / subject knowledge for teacher
Background information / subject knowledge for teacher
Water clocks were among the earliest timekeepers that didn't depend on the observation of celestial bodies. One of the oldest was found in the tomb of the Egyptian pharaoh Amenhotep I, buried around 1500 BCE. Later named clepsydras ("water thieves") by the Greeks, who began using them about 325 BCE, these were stone vessels with sloping sides that allowed water to drip at a nearly constant rate from a small hole near the bottom. Other clepsydras were cylindrical or bowl-shaped containers designed to slowly fill with water coming in at a constant rate. Markings on the inside surfaces measured the passage of "hours" as the water level reached them. These clocks were used to determine hours at night, but may have been used in daylight as well. Another version consisted of a metal bowl with a hole in the bottom; when placed in a container of water the bowl would fill and sink in a certain time. These were still in use in North Africa in the 20th century.
More elaborate and impressive mechanized water clocks were developed between 100 BCE and 500 CE by Greek and Roman horologists and astronomers. The added complexity was aimed at making the flow more constant by regulating the pressure, and at providing fancier displays of the passage of time. Some water clocks rang bells and gongs; others opened doors and windows to show little figures of people, or moved pointers, dials, and astrological models of the universe.
In the Far East, mechanized astronomical/astrological clock making developed from 200 to 1300 CE. Third-century Chinese clepsydras drove various mechanisms that illustrated astronomical phenomena. One of the most elaborate clock towers was built by Su Sung and his associates in 1088 CE. Su Sung's mechanism incorporated a water-driven escapement invented about 725 CE. The Su Sung clock tower, over 30 feet tall, possessed a bronze power-driven armillary sphere for observations, an automatically rotating celestial globe, and five front panels with doors that permitted the viewing of changing manikins which rang bells or gongs, and held tablets indicating the hour or other special times of the day. Since the rate of flow of water is very difficult to control accurately, a clock based on that flow could never achieve excellent accuracy. People were naturally led to other approaches.
Adapted from: Inventors, About, Website
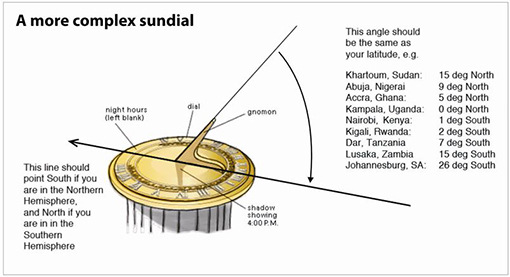
Resource 3: Sundials
![]() Background information / subject knowledge for teacher
Background information / subject knowledge for teacher
The Egyptians formally divided their day into parts something like ours. Obelisks (slender, tapering, four-sided monuments) were built as early as 3500 BCE. Their moving shadows formed a kind of sundial, enabling people to partition the day into morning and afternoon. Obelisks also showed the year’s longest and shortest days when the shadow at noon was the shortest or longest of the year. Later, additional markers around the base of the monument would indicate further subdivisions of time.
Another Egyptian shadow clock or sundial, possibly the first portable timepiece, came into use around 1500 BCE. This device divided a sunlit day into ten parts plus two ‘twilight hours’ in the morning and evening. When the long stem, with five variably spaced marks, was oriented east and west in the morning, an elevated crossbar on the east end cast a moving shadow over the marks. At noon, the device was turned in the opposite direction to measure the afternoon ‘hours’.
In Europe, during most of the Middle Ages (roughly 500 CE to 1500 CE), technological advancement virtually ceased. Sundial styles evolved, but didn’t move far from ancient Egyptian principles.
Adapted from: Inventors, About, Website
Resource 4: Units of time
![]() Teacher resource for planning or adapting to use with pupils
Teacher resource for planning or adapting to use with pupils
Time
|
Many timetables and digital watches use the 24-hour clock time. Use this scale to change between 12-hour and 24-hour time. |
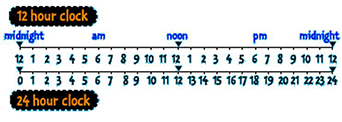 |
6:15 am → 06:15 6:15 pm → 18:15 Remember:
|
Here is a way to remember how many days there are in each month. 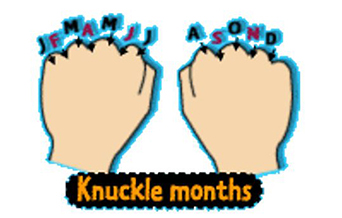
|
Section 3: Discussing data
Key Focus Question: How to help pupils confidently discuss data, they have collected and collated.
Keywords: survey, data collection data analysis, Interpretation, pie chart/ bar chart, pictogram, histogram, line graph, scatter graph
Learning Outcomes
By the end of this section, you will:
- be familiar with a range of different data sets that pupils can usefully collect for analysis;
- have developed your subject and pedagogic knowledge of graphically representing data;
- have developed and used a structured question approach to assess understanding.
Introduction
This section is a practical section where pupils themselves collect data, decide how best to represent this data and are able to analyse it. Through whole class discussion decisions are made by the pupils themselves with guidance from you. The assessment of this topic is done successfully by using a structured question approach. There are three aspects dealt with here – the collection of data, using what they already can do and new methods to count things - and keeping records of the data, and analysis of this data. In all these activities the pupils themselves play the major role.
1. Organising surveys to collect data
Pupils are often more interested in working with data that they have collected themselves – they know what the numbers are describing, and how the numbers came to be. In this section there are several suggested activities to get pupils collecting data. These surveys help the pupils to understand the concept of data collection and pupils are encouraged to continue collecting interesting data outside school.
Organising your class into groups so that everyone is able to contribute is important so that they are all able to participate. Whole class discussion can be used to share the data from the different groups.
Case Study 1: Using group surveys to gather data
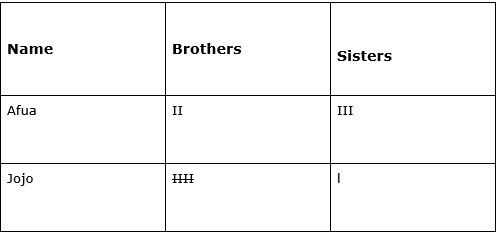
Mrs Kazulu in Uganda decided to have a completely practical lesson and divided her class into three groups (if you have a big class you may need more groups) to engage in small classroom surveys to collect data (see Key Resource: Using group work in your class room to help you). She chose surveys that were relevant to the pupils themselves asking one group to find out the number of siblings in their families and to record this in their exercise books, another to determine the number of letters in their names and the third to find the number of pupils from different districts in their class.
Mrs Kazulu drew a template like the one shown in Resource 1: Tally chart and suggested each group had a similar one. She gave them time to copy her chart and then asked them to work one group at a time going round the class and asking how many siblings they had for example.
They went in pairs to ask each pupil their questions. All groups later shared their data and were asked to display it in the classroom. Mrs Kazulu would use the data collected in future lessons.
Activity 1: A whole-class survey
Before you begin show your class how to do a tally. (See Resource 1). Ask them why this might be a useful technique.
Discuss with your class about their birthdays and then ask them also to suggest the best way to organise the list of the different months of the year. Then ask each pupil to call out the month of his or her birth and let each pupil record this information as it is being called out.
Next ask one pupil for each month to count up the birthdays and put in the total.
You may extend this work by setting an individual homework task, such as to survey the favourite sport or drink of family or friends. Next lesson, discuss what the data tells you. Ask your class to think of other data they could collect like this and let them have another go at practising these skills?
What other ways could you organise your pupils to collect such data?
2. Interpreting and creating charts in groups
Collecting data is only part of some investigations as it may need to be analysed and displayed to understand it better or to share the information with others. Pupils can show their data, by using pictographs, pie charts, bar graphs, histograms or line graphs. It is important that pupils know which to use for different sets of data and so your examples should be clear. An overview of different kinds of charts is given in Resource 2: Data handling and Resource 3: Charts and graphs
Again you will use data from the pupils’ own experiences but it is a good idea to bring various examples to class from newspapers, magazines and government publications to see some of the ways it is done.
Helping pupils understand the different kinds of chart, takes time and you will need to plan several activities on each method to develop their understanding.
Case Study 2: Drawing a chart
After spending time collecting data, Mrs Nikoi wanted her pupils to make their own decisions about how they would display the data they had collected. She brought to class examples that she had found in newspapers, magazines and government documents, but selected only 3 types of chart for them to see . There were many examples of educational statistics concerning pupils and schools that she felt would interest them in particular. She obtained some of these from her local education office. They had had some experience the year before of all three types of chart and so Mrs Nikoi only had to remind them of their use.
After a class discussion on the various ways these statistics were displayed she asked her pupils to return to their groups and decide together how best to display their data. Most of them wanted to do a bar chart and so Mrs Nikoi reminded them how to do this (see Resource 3) and then supported them as each group drew their own chart. They showed their results to the rest of the class. Mrs Nikoi thought that this method was more learner friendly than merely telling her pupils what to do and allowed them to feel ownership of their work and what they had found out.
Activity 2: Data presentation
Beforehand use Resources 2 and Resource 3 to familiarise yourself with the different kinds of charts. Use Resource 3 to make sure you understand the uses and key teaching points for each chart type.
Collect examples of data displayed as pie charts, pictographs, bar charts and line graphs to share with your pupils as seeing data displayed in this way will help them see the relevance of selecting the proper chart. Spend time explaining what kind of information is best displayed by each chart.
Plan a sequence of lessons, where you will teach learners how to construct each type of chart, and how they will practise this skill. For each kind of chart, think of an appropriate source of data for your learners to collect, and how you will support them through the process of constructing their charts.
3. Assessing understanding
This final part is on analysis and interpretation of data once it has been displayed. It will enable you to assess the success of your teaching. Using information from the science teacher or another subject teacher shows that data collection and analysis is important across the curriculum; it also allows you to collaborate with other subject teachers and gain support. The activity and case study show how your pupils can use new data as a way to assess their understanding.
You may decide to use a structured question approach (see Resource 4: Structured questions) for your assessment, so that you can find out exactly how much each of your pupils has learned.
Case Study 3: Assessing understanding of data handling
Mr Sule wanted to make sure his pupils were confident at handling and interpreting data. He also wanted to show them what information they could get from their charts.
He asked the science teacher to provide him with data on rainfall for the area for the last year and asked his pupils to use this to draw a chart that showed the data well. He asked pupils to work in pairs to help each other with this task. Each pair had to agree on the best kind of chart to use.
Mr Sule asked them to note the title, the units used, the scales, what the axes represent, the highest and lowest points and any patterns in the chart, and to write a few sentences to explain what the chart showed them.
Mr Sule was pleased with their response and felt that his lesson had been successful. He displayed the pupil’s charts on the classroom wall.
Key Activity: Assessing data analysis and interpretation
To assess your pupils ability to analyse and interpret data, you can use a structured question approach which has gradually harder questions - easy ones that all pupils can answer, middle ones which can be answered by the majority of the pupils and a last one which can be answered only by the more able pupils.
- Write the data on the board or on a piece of newsprint (some example data is given in Resource 5: Kano's rainfall.
- Write the questions on a separate sheet of paper.
- Show the chart and questions to the class and explain they are to work on their own and to draw a chart using the data and then answer as many questions as they can.
- Give the class a lesson to do the activity.
- Collect and mark their work.
Next lesson give feedback to the class about what they did well and where they need support and say how you will do this.
Resource 1: Tally chart
![]() Teacher resource for planning or adapting to use with pupils
Teacher resource for planning or adapting to use with pupils
Making tally marks is a useful and old way to count things in different categories. It involves making a mark or placing a stroke for each item counted in the particular group. You could make a tally of almost anything. Here are some examples:
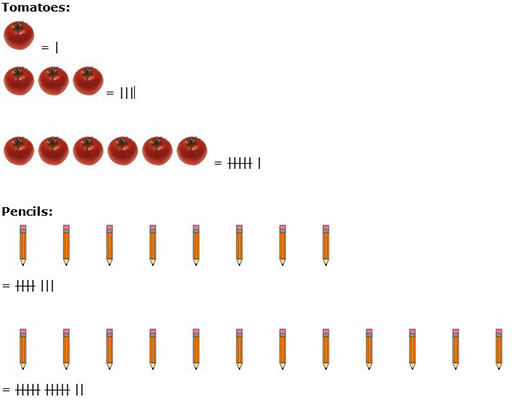
The chart below shows a chart started for siblings in a class of 56 Primary class 4 Grade 4 pupils. Each bundle of marks IIII represents five children.
Resource 2: Data handling
![]() Background information / subject knowledge for teacher
Background information / subject knowledge for teacher
Data is information. Interpreting data means working out what information is telling you.
Information in newspapers, on television, in books and on the internet is sometimes shown in charts, tables and graphs.
It is often easier to understand the information like this rather than in writing, but it is important to read all the different parts of the graph or chart.
Charts
The title tells us what the chart is about
The column headings tell us what data is in each column:
- the name of the bike
- what colour it is
- its price
- and how many gears it has
You can use the chart to find out information about each bike by looking at each row in turn
- The Ranger is silver and has 5 gears
| Name | Colour | Price | Gears |
| Volta | Silver | Gh¢ 1,400,000 | 5 |
| Harmattan | Red | Gh¢ 1,800,000 | 10 |
| Anansi | Blue | Gh¢ 1,900,000 | 15 |
| Goldburst | Silver | Gh¢ 1,200,000 | 15 |
| Mountain | White | Gh¢ 1,000,000 | 5 |
Graphs
Graphs come in many different styles
Bar Graph

Tip: With any graph, always look carefully at
- the title
- the scale
- the axis headings
Bar-Line Graph
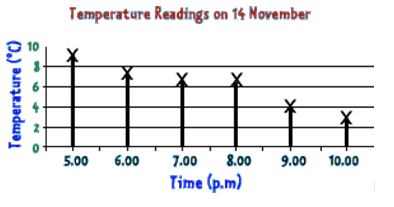
Tip: With any graph, always check the scale. Often each division is worth more than one number.
Line Graphs
are made by joining the tops of bar-line graphs. This can make it easier to look at the shape of the graph.
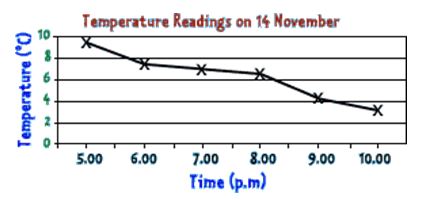
This line graph shows that the temperature is falling each hour.
Pie charts
Pie charts are circular, like a pie! Each section of the pie shows a fraction of a total amount. This pie chart shows where 40 children in England went on their last holiday.

One quarter of the people went to Europe. That means 10 people (40 ÷ 4) people went to Europe.
The UK was the most popular holiday destination. Can you work out the second most popular?
Frequency tables
A frequency table shows information about a set of data. Sometimes there is so much data that the only way to show it all is to put it into groups called intervals.
This graph shows the heights of a class of children. The heights are grouped in equal intervals of 5cm. This means that 1.30 - 1.34 includes children with heights of 1.30m, 1.31m, 1.32m, 1.33m and 1.34m.
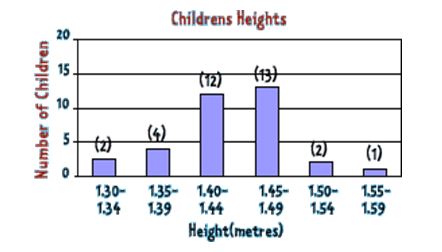
Adapted from: BBC Schools, Website
Resource 3: Charts and Graphs
| Goats | 21 | ||
| Chickens | 36 | ||
| Dogs | 8 |
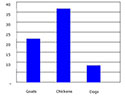 | Bar charts are good for representing categoric data (data that fits into separate groups). They are easy for pupils to draw, as they do not have to do calculations, but only read off 'how high' to go from the scale. Working choosing and using the correct scale is a key learning activity in early work with bar charts. Pictograms are a variation of a bar chart, where the pupil draws pictures (e.g 8 dogs) instead of a bar. |
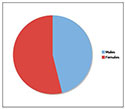 | Pie charts are good for representing categoric data (data that fits into clearly separate groups). They are especially useful for seeing what proportion of the whole is represented by a particular category. Making a pie chart is quite complicated for young pupils. They have to work out the relationship between the numbers they have counted, and the angle required in the pie chart. |
Resource 4: Structured questions
![]() Background information / subject knowledge for teacher
Background information / subject knowledge for teacher
A structured question is one which has three parts.
- Part 1 is easy and can be answered by all pupils.
- Part 2 is a bit more difficult but can be answered by the majority of pupils.
- Part 3 is more difficult and tests the more able pupils.
Here is an example.
Alice and Mary are having an argument. Alice says that it is hotter this week than it was last week. Mary thinks it was hotter last week. Here are the temperatures for the two weeks.
| Mon | Tues | Wed | Thurs | Fri | Sat | Sun | |
|---|---|---|---|---|---|---|---|
| Week 1 | 22ºC | 21ºC | 19.5ºC | 23ºC | 23ºC | 23.5ºC | 22ºC |
| Week 2 | 18ºC | 19ºC | 23.5ºC | 25ºC | 26ºC | 24ºC | 22ºC |
- a.Draw the temperature for both weeks on the same line graph, using different colours for each week. (Part 1)
- b.Which week showed the highest temperature? (Part 2)
- c.Which week showed the lowest temperature? (Part 2)
- d.Find the mean temperature for each week. (Part 2)
- e.Find the range of temperatures for each week. (Part 2)
In some ways Alice is right and in some ways Mary is right. Explain. (Part 3)
Adapted from: The New Uganda Primary Mathematics Pupil’s Book 7, P122
Resource 5: Kano’s rainfall
![]() Teacher resource for planning or adapting to use with pupils
Teacher resource for planning or adapting to use with pupils
| Month | Average rainfall (mm) |
|---|---|
| January | 0 |
| February | 0 |
| March | 3 |
| April | 10 |
| May | 69 |
| June | 117 |
| July | 206 |
| August | 310 |
| September | 142 |
| October | 13 |
| November | 0 |
| December | 0 |
Section 4: Working with weight
Key Focus Question: How can practical work be used to teach the measurement of weight using inexpensive resources?
Keywords: Standard units, grams, kilograms, practical work, balances, extension, differentiation, groups, demonstration.
Learning Outcomes
By the end of this section, you will have:
- helped pupils develop their understanding of weight by using progressive practical activities;
- explored ways to establish pupils’ understanding of the need and use of standard units for weight;
- explained different ways to organise your class.
Introduction
When exploring weight with pupils it is important to use a lot of practical hands on activities in the early stages so that they are able to build up mental models which will help their understanding in later stages. In this section you will plan ways to introduce your pupils to the concept of weight by following three stages:
- comparing weights of two or more objects by holding them at the same time
- estimating and measuring weight of objects using non-standard units such as stones
- measuring and comparing the weight of objects using standard units
Central to this work is the use of simple balances and using standard units that can be made from cheap and readily available materials, to enable practical group work and active learning.
1. Doing practical work in groups
Estimation is an important skill in both mathematics and science and a useful skill to cultivate for all pupils. Simple balances can be made with very modest resources that allow pupils to approach measuring and estimating weight through practical investigation. You may like to make simple balances and plan and carry out these activities jointly with a science teacher in your school. This can be done by helping pupils to compare and contrast weights in different ways.
Case Study 1: Estimating weight
Mrs Nkumu in Nigeria was on a teachers’ course at her local district offices and as part of the day’s lesson on numeracy the facilitator told the following story to them. Then she asked them what they thought the girls knew and what would they do next with these pupils if they were in their class.
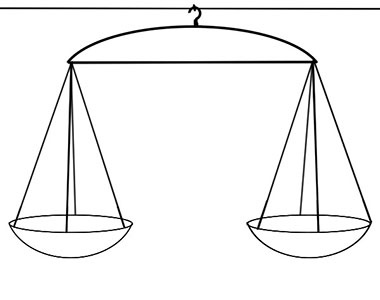
‘Two girls, Ranke and Ade, were discussing the quantity of popcorn in two packets, A and B which looked the same shape and size. Ronke picked up the packets one after the other and was surprised that B felt heavier than A. She told Ade that B appeared to be heavier than A. Ade decided to put the two packets in the two pans of a simple balance. (See Resource 1: Simple balance). She observed that on the scale, packet B went down and so B is heavier than A. Ronke was right.’
The teachers worked in pairs and devised activities that encouraged estimation of heavier/lighter, then using a balance or scales to test their ideas. Each pair tried their lesson out with their class and reported back next session.
Mrs Nkumu found that her class enjoyed the lesson but that she did not have enough different objects for the pupils to use. Next time she said she would spend more time collecting objects and she would use smaller groups of 4-6 rather than over 10 each.
Activity 1: Comparing weight
You will need 5 simple balances (see Resource 1) to carry out this activity and 5 sets of common objects e.g. stones, balls, tins, bottle tops etc that could be used with the balances.
Write instructions for your pupils on the board (see Resource 2: Worksheets) and show the class what you want them to do using any two objects.
Ask them to estimate which is heavier by giving the objects to 2 pupils to answer.
Now ask a pupil to test their idea out by putting them on the pan and let them decide.
Ask them which is the heaviest object and why they think so.
Organise your pupils into 5 groups, giving each group a set of objects and a balance. Ask pupils to find which object is heavier by estimating its weight and then by using the balance. (See Key Resource: Using group work in your classroom)
Ask them to fill in a table of their results to share with the class to see if everyone agrees.
You could challenge older or more able pupils to see if they can order their objects from heaviest to lightest before testing. How could they test their answers using the simple balance?
2. Introducing units to compare weights
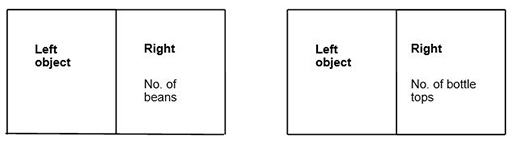
When developing understanding of the idea of weighing it is better if non-standard units are used to measure first. If pupils compare and contrast weights against non-standard unit bottle tops or beans they will quickly understand this is not sensible as the weight of different bottle tops and seeds vary. This is made easier by making sure they have sufficient experience weighing objects against different non-standard units.
Only when pupils understand the need for a common unit should the introduction of standard units like grams or kilograms begin.
Case Study 2: Using a ‘standard’ unit to measure
Lizzy, a Primary school teacher, felt that having taught her pupils how to use a simple balance to compare weights of objects, they should now compare the weight of any object with that of a given chosen ‘standard’ object.
She assembled different objects and chose dry beans to be her chosen measure. Using the balance she asked two pupils to place an object on one pan and put enough beans on the other until it balanced. They counted the beans for each object and recorded their results.
Next she used some longer beans and weighed the same objects and recorded these results. She talked with the class about the difference in numbers between the two kinds of bean and how difficult it was to compare the weight of a stone and wood if one person used one set of beans and the other used the bigger beans.
Activity 2: Data presentation
Before doing this, read Resource 3: Pupil instructions for weighing activity and collect together the following resources – enough for your size class.
- simple balances
- collect objects of similar weights to use as measures (e.g. bottle tops and beans)
- objects of different weights to measure (e.g. small bottles, tins or stones).
You could just collect enough for one group and have each group take turns to do the activity while the others do different work.
Write the instructions for the groups on the board and explain what they have to do.
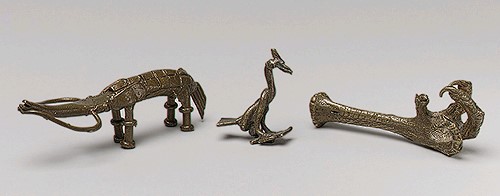
Resource 4: Traditional weights used in Ghana. These are examples of Akan weights used in trading. Notice that they are fashioned very beautifully.
(See Key Resource: Using group work in your classroom)
At the end, ask them to compare how it was different using beans or bottle tops to measure the weight, rather than just comparing pairs of objects. Note their answers on the board. Ask if they think this is a fairer way to measure.
Ask pupils to list the objects in order from heaviest to lightest – is this harder or easier than before? Why?
3. Being resourceful
The previous activities should have shown your pupils that ‘standard units‘ of weight are needed because without these it is not possible to accurately compare or know how much something weighs. This next part explores how you can introduce terms and develop their understanding of kilogram (kg), and gram (g) (1000 gram = 1 kilogram). You may want to bring bags of sugar and rice to class, to show their weight is recorded in grams or kilograms and for them to feel the actual weights or make some mock ones i.e. plastic bags filled with sand, stones etc to the correct weight. If you can, borrow a pair of scales to do this.
If you do not have access to calibrated weighing scales or weights at school, it may still be possible to make approximate measurements of weight using your simple balances, and using some every day objects that have their weight on them to test them against. The second focus in this part is on understanding the terms gram and kilogram and being able to convert one to the other. This kind of activity should only be undertaken when pupils are confident at weighing in grams and kilograms.
Case Study 3: Using homemade standard units
Mr. Adu wants his pupils to estimate, measure and compare weights of 1 object in grams and kilograms. He asked permission from a secondary school science department to use their balances to make bean-bags weighing 100g, 50g and 10g (using different coloured cloth for each weight). He asked some of the parents who work in the local sewing shop to help him sew several sets for his class.
He demonstrated the weighing of objects in grams using the improvised weights and a simple balance, and then asked pupils to weigh objects to the nearest 10g, and record their results in a table.
| Object | Weight |
|---|---|
| |
|
The pupils were very enthusiastic and weighed nearly everything they could find in the classroom. Mr Adu listened to their talk as they weighed and was pleased to hear them using the correct terms easily
Key Activity: Weighing in grams
Before the lesson, collect a number of objects that have their weights shown – tinned or packet foods and other goods (you only need the wrapper, not the whole good). Try to have enough to give each group of pupils at least two or three labels. It would also be good to have some labels for weights in kilograms as well as grams.
Ask groups to write down the name of the product, and its weight – ensure that they include the correct units (grams or kilograms). They could do this by using the actual bags and putting them in order on their table. Pupils could arrange and re-arrange the packages by weight from highest to lowest or lowest to highest or sort into groups:
- > 500 grams or
- < 500 grams
Then ask pupils to convert each weight from kilograms to grams or vice versa.
When they have finished ask each group to swap their sheets with another group and they can check each others answers. Remind them that 1000 gram = 1 kilogram.
Discuss with your pupils why they might need to be able to convert weights in their everyday lives.
Display their work on the wall to show each group their achievements.
What did the groups learn and how do you know this? You could ask them to tell you what they think they have learnt.
Resource 1: Simple balance
![]() Teacher resource for planning or adapting to use with pupils
Teacher resource for planning or adapting to use with pupils

Resource 2: Worksheets
![]() Teacher resource for planning or adapting to use with pupils
Teacher resource for planning or adapting to use with pupils
- One member of the group picks up and feels the weight of two objects, e.g. a stone and a bean, one after the other. Which feels heavier? Complete the table below.
- Another member now uses the balance to compare the weights and completes the table
- Repeat this for all the objects, comparing two objects at a time, allowing each member of the group to participate.
- Pin your table on the wall and look at each others results.
| Objects | Which feels heavier | Which weighs heavier on balance |
|---|---|---|
| the ball and a bean | the ball | the ball |
| a bean and a stone | the stone | the bean |
| a bean bag and a stone | ||
| ||
|
Resource 3: Pupil instructions for weighing activity
![]() Teacher resource for planning or adapting to use with pupils
Teacher resource for planning or adapting to use with pupils
- Put the object to be weighed, say 1 milk tin, in the left scale pan of the balance. Place one bean in the other scale pan. Which is heavier?
- Add more beans one at a time, in the scale pan on the right until the two sides balance. How many beans do you require for this?
- Repeat using bottle tops instead of beans.
- Repeat (1) and (2) for each of the objects to be weighed.
Record your observations in the form of the table below
- Find out how many bottle tops weigh as much as 10 beans.
- Find out how many beans weigh as much as 10 bottle tops.
Resource 4: Traditional weights used in Ghana
![]() Background information / subject knowledge for teacher
Background information / subject knowledge for teacher
Section 5: Working with distance
Key Focus Question: Developing practical and imaginative approaches to developing pupils understanding of distance.
Keywords: Measurement, length, distance, comparison, active, practical, group, pair, investigative, proof.
Learning Outcomes
By the end of this section, you will have:
- developed ways of teaching measurement of length in a more pupil-centred way;
- developed your ability to facilitate and assess practical investigations using distance as a context.
Introduction
This section deals with the important process of investigations and their value in mathematics education. Investigations can be done in class, individually or in groups. They can also be done at home by individual pupils, and either be presented to the whole class verbally or be presented formally as written work.
Investigations are based on having an idea or a phenomenon that you want to find out about and to do this you are encouraged to undertake various tasks that enable you to find answers to your questions. Investigations can include practical work but can also be mental activities as you search books etc for answers.
This section will help you develop pupils’ spatial understanding, as they learn to solve problems through estimating, measuring, drawing, experimenting, constructing, interpreting and calculating lengths and distances.
1. Organising an investigation
Any investigation needs to be planned and conducted carefully otherwise the results might be incorrect or unreliable. In this activity you will look at a statement that needs to be shown to be right or wrong.
Make sure your pupils have all they need before they start an investigation, and that they understand the task before they explore what they might do to make a start. Your role is to support them as they work by asking questions to stimulate their thinking, by encouraging to develop their ideas.
Case Study 1: Using questions to prepare for a practical investigation
Mrs Mwakapenda in South Africa wanted to give her pupils a practical investigation on length. She prepared some questions to ask them because she wanted to ensure that they understood the task properly. She began her lesson by discussing the questions with the whole class. (SeeResource 1: Sample questions).
She was aware that the investigation was not just about measuring. It was also about collecting and recording data. She wanted to make sure her pupils understood exactly what it would entail. She was very pleased with what her pupils achieved because they knew how to organise an investigation. They had carried out a fair test and measured the distances well too.
Activity 1: Who can jump the furthest?
Begin by asking your pupils to consider the following statement and discuss in groups of 4 how they would investigate whether it is true.
“A tall person can jump further than a short person”.
Each group needs access to a tape measure or ruler or some other means of measuring e.g. string or rope. Discuss how they might answer the question and agree on a process. This might be like this:
- Take two measurements for each person and measure everyone in the group
- Measure height by standing against a scale on a wall which you made before the lesson
- The jump must be a “standing” jump – the person stands on a line, and then jumps as far as they can
- Measure the length of the jump using a tape measure or string etc
You know that the difficult part is how the results are checked. There are various ways to do this but you must see what your pupils decide to do. Discuss / show / share what the groups find out. See Resource 2: Two ways to check for ideas.
Do your measurements agree with the statement? If not, rewrite the statement to match your results.
2. Letting pupils plan their investigations
When exploring a topic such as measuring it is important not to rush onto new concepts but to give pupils time to consolidate their learning and practise newly learnt skills. This section provides more ways to explore their understanding and abilities to measure length in different contexts.
These activities ask pupils to make comparison between measures and think about any links. By using the same groups for a series of activities you can discover whether they see the similarity between the investigations and are able to employ the data and the strategies they used before.
Case Study 2: Organising pupils’ own investigations
Mrs Asante decided to undertake another measuring task but provide less guidance. as she wanted her class to be more independent and to use the skills they learnt from the previous task. She observed her class carefully as they planned as she was interested to know who realised they could use the previous knowledge and ways of working for the new task.
When the principal talked of moving the school gate to a place he said was nearer, to help save money on the path, Mrs Asante was not sure it was nearer and she decided this was a real problem to use with her class.
She set the problem for her class in the morning and asked them to work on it until the end of the day. They also had to do their language work but could choose in which order to work. As she only had two long tape measures she had borrowed from the education offices, it limited the number of groups that could work with these at any one time. They could use other ways to measure such as rope or string. She was pleased how well they organised themselves and as they worked she noticed who understood the problem and how to solve it. All the groups agreed that the new site for the path was much nearer. She then asked them to work out how much money would be saved from the path.
They took their investigation to the principal who was very pleased with the information.
Activity 2: Investigating height against arm-span
Begin by telling your pupils that there is another investigation for them to do in the same groups as before.
Ask them to find out if this statement is true:
“Your height is the same as the distance between your finger-tips with your arms outstretched”.
Ask them to discuss in their groups:
- How they could check these statements?
- What are they going to be measuring?
- What units of measurement would you use?
- How will they organise the work?
- How will they record their results?
Next you ask them to do the investigation together, or at different times depending on your resources, and you go round and listen to them as they work, supporting them if they are having difficulty. Ask them to show how they worked out the answer. Display their answers.
During sharing, discuss what you have observed about how they worked as groups.
How can you help them work better in groups (see Key Resource: Using group work in your classroom)?
3. Assessing understanding of length
It is important that pupils have a real-life ‘feel’ of what different lengths mean. To assess whether they have this feel you can use a question to solve on paper that requires them to use their understanding or give them a final investigation about a real object such as the task in the key activity.
When the task is complete, encourage your pupils to find out more about the indigenous trees of your country and have a go at measuring a large tree near your school if there is one. Working in this practical way will build their confidence in dealing with length.
Case Study 3: Assessing understanding of length
Mrs Otu from Mamfe D/C Primary wanted to find out if her pupils had a real idea about different lengths so she designed a paper activity that they had to do individually to assess their understanding. She copied the activity onto the board (See Resource 3: Questions on length). She asked her pupils to work on their own and think carefully about the answers before they filled in the gaps. She collected their books and looked at their answers.
She realised that many of her pupils had not got a real feel for length yet and so she decided to do more practical activities. She asked them to measure the school grounds but they had to estimate the length of each side first and record this. Each group took it in turns to do the measuring as she only had one long tape. She had made a large table of the key measurements and each group put in their measurements as they finished. She did not display this until all groups had finished so they would not be influenced by others results. (She planned to use this data later for a geography lesson to produce a scale map of the school site).
When all had completed the measuring she discussed the variations in their measurements with them and then asked them why this was so. They were able to suggest some good reasons such as starting at different points and not holding the tape straight.
Key Activity: How big is the big tree?
Read Resource 4: Big tree in Budongo Forest before you start and plan for the lesson, but think how you might adapt this to your pupils’ needs and find a very long tape measure. If possible take your pupils outside to where there is a lot of space, otherwise use a large hall to try out the activities. You will also need about 40 pupils of average 1m height and so you may decide to combine with another class. Work with the whole class together and asking guiding questions, help them solve the problem. Read the following extract about the ‘Big Tree’ to the class.
In Ghana in the Esen Epan Forest Reserve there is a very old giant tree, simply known as the “Big Tree”. It is about 66.5 m high and has a circumference of 12m and believed to be the biggest in West Africa.
Show them the picture as you start your lesson (seeResource 4).
When you have finished outside bring the class inside and ask them to answer the questions in Resource 4 to assess their understanding.
Next lesson, ask them to make a display of the tree and all their measuring activities in the classroom and invite other classes to come and see their work.
Resource 1: Sample questions
![]() Background information / subject knowledge for teacher
Background information / subject knowledge for teacher
- What do you understand by the height of a person
- How are you going to measure yourself?
- Should you have shoes on or off, while measuring? Why?
- Should you lie down or stand up against the wall? Why?
- What about those with long hair, should they squash it down? Why?
- Where should you measure from?
- What should you use to measure with?
- How accurate should you be?
- Which is best to; use a ruler or tape measure? Why?
- How should you collect and record the measurements?
Resource 2: Two ways to check
![]() Background information / subject knowledge for teacher
Background information / subject knowledge for teacher
- One way of checking that the statement is true is to make a table with two columns, one for the heights of the pupils going in order from the tallest down and the other for the lengths of the corresponding jumps. Only if the order is the same is the statement true.
- Another way is to make a mark with a cross on a grid using square paper with the pupil’s height on the horizontal axis and the length of jump on the vertical axis. Only if the result of the crosses is a straight line is the statement true.
- Is the statement true most of the time but not always? What would explain this?
Resource 3: Questions on length
![]() Teacher resource for planning or adapting to use with pupils
Teacher resource for planning or adapting to use with pupils
Some pupils in Primary Class 3 measured different things in school. These are the measurements they wrote down:
- a.4 metres
- b.1 and a half metres
- c.19 metres
- d.11 and a half metres
Below is a list of the things they measured. Match each length or height against the most likely object below.
Solomon in Primary 3
The length of the school building
The length of the teacher’s table
The height of the classroom
Resource 4: Big tree
![]() Teacher resource for planning or adapting to use with pupils
Teacher resource for planning or adapting to use with pupils
Ghana's Big Tree

The “Big Tree”, which is one of the most attractive tourist spots in the country, is located in one of the district’s nine forest reserves, called the Esen Epan Forest Reserve, about 22 kilometres from Akim Oda on the Oda – Agona Swedru trunk road. The tree, believed to be the biggest in West Africa, is 12 metres in circumference and 66.5 metres tall.
The district’s nine forest reserves are good for game and wildlife parks, souvenir shops and the like. Areas around the “Big Tree”, which is already a prime tourist attraction, can be complemented with good access road, eating and relaxation places, souvenir shops and other such things The beautiful sceneries along he banks of the Birim River are also good for the development of camps and chalets, particularly, areas around Oda Secondary School.
The height of the Big Tree
Remind your pupils that the height of the tree is 66.5 m. Ask them:
‘Do you think if all the pupils here were to balance on each other’s heads you would eventually reach to the top of this tree?
That would not be easy and so what else can we do? Yes, we could try lying down instead.
Let’s do that.’
Ask about ten pupils to lie down and ask another pupil to measure and see if that is enough.
Now ask: How many pupils do you think it will take?
Add more pupils until how many it takes to make 66.5 m is reached.
Finally, ask someone to describe how tall the Big Tree is.
The circumference of the Big Tree
We are told that the circumference of the tree is 12 m. That means that if you wanted to tie a string around this tree, you would need to go to where the tree is growing and use a string12 m long. This is probably not possible, but you could try measuring a local tree for pupils to practise.
How many pupils do you think it would take if you wanted to make a ring around the tree, with fingers touching? Try it by getting one pupil to measure 12 m. Then form a circle and count the pupils – this will give you an idea of the circumference of the tree.
Now try these questions with your group (you could ask them before the exercise and then get them to check their answers after)
1. Before this activity I thought 66.5m was:
- As tall as my school building
- As tall as a mountain
- As high as a tall tree
- As tall as a telephone tower
- Hadn’t thought about it
2. It would take the following number of classmates to make a ring around the “Big Tree”:
- At least 7
- At least 6
- At least 5
- At least 4
- At least 3
3. 1m in length is approximately:
- The span from the tip of an average person’s nose to their fingers.
- The height of an average person
- The length of a small table
- The height of a cow