Use 'Print preview' to check the number of pages and printer settings.
Print functionality varies between browsers.
Printable page generated Tuesday, 28 July 2026, 12:23 AM
Key Resource: Tools for planning and carrying out investigations in Science
Key Resource: Tools for planning and carrying out investigations in Science
Step 1 - Brainstorming or getting ideas
| What could we investigate | ||
|---|---|---|
| ||
| What could we measure or observe? | ||
| ||
This table is made available to the children. This may be put up on the wall as a poster or written on the board. The teacher then initiates a class discussion on the investigation topic. |
| What could we investigate | ||
|---|---|---|
| light | temperature | quantity of medium |
| acid rain | seed type | closeness of seeds |
| What could we measure or observe? | ||
| light | Temperature | volume of water |
This table is made available to the children. This may be put up on the wall as a poster or written on the board. The teacher then initiates a class discussion on the investigation topic. Example: Investigation into factors that affect germination and growth. The teacher may begin by reminding the children about what germination means, then pose the question: What affects germination? The purpose of the investigation is to discover if and how a particular factor affects germination in a particular plant, e.g. cress. The children are asked to suggest any factor that might affect the germination of cress. |
Step 2 - Choosing the variables
| I am going to find out what happens to ...
|
| ... when I change ...
|
| I am going to keep these the same (constant) to make it fair ...
|
Once again the table is made available to the children. This may be put up on the wall as a poster or written on the board or copies given to group leaders or to all the pupils. The group are asked to select one variable that they will change (independent variable) and one that they will measure (dependent variable). All the other variables must be kept the same if there is to be a fair test. |
Fair Testing
The concept of a fair test is crucially important in planning an investigation. The pupils should be taught to control the variables other than the dependent and independent variables in a conscious way. Often the more ‘obvious’ a variable is, the more likely it is to be controlled, but the pupils should be trained to consider their set-up and decide on the variables to be controlled.
A fair test is one in which only the independent variable is seen to cause a change in the dependent variable. If, for example, two things change, say temperature and humidity, you cannot be sure which of these causes the change in the dependent variable; it may be temperature or it may be humidity or it may be a combination of both.
- It is only by carrying out a fair test that you can be sure that it is what you have changed (independent variable) that is affecting what you measured (dependent variable).
- It is easier to recognise that a test is fair than it is to plan and carry out a fair test.
- You will need to encourage the pupils to make sure that all relevant aspects have been controlled (kept the same).
- Most pupils need only say that they intend to keep certain things the same, but the most able pupils should be encouraged to discuss what value each control variable should have.
Note: the words independent variable and dependent variable do not need to be taught at this stage!
Step 3 - Asking a question
| Making a prediction/hypothesis | |
When we increase/decrease
| temperature
|
... we think that the
| number of seeds germinating
|
will increase / decrease / stay the same
| |
At this stage, pupils are being asked to select the variable they want to investigate. They choose one of the things that they have said they could change and one of the things that they said they could measure. The question posed is: If I change this (the chosen variable or independent variable), what will happen to that will increase / decrease / stay the same (the chosen measurement or dependent variable)? |
Step 4 - Planning the experiment
| Designing the experiment | |
|---|---|
| Listing what you need | Describe how you will use them. Make a diagram if you want. |
30 cress seeds cotton wool 3 dishes cling film thermometer water | 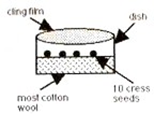 |
| |
The pupils now plan the experimental procedure. It is very important to stress that only one of the variables can be changed during the experiment. As a result the variable being measured will, presumably, change. All other variables must be kept constant to ensure a fair test. |
Step 5 - Carrying out the experiment
Before they carry out their experiment it is important that the teacher makes sure that the procedure to be followed is safe. For this reason it is important to include a TEACHER CHECKPOINT before the pupils are allowed to continue with the practical and to ensure that suitable safety precautions are used.
The pupils collect evidence by carrying out the experiment and carefully noting the changes occurring in the dependent variable. They may also measure the variables they are keeping constant to ensure that they are kept constant throughout their experimental procedure.
Step 6 - Recording and Presenting (1)
| What we changed | What we measured |
| temperature (°C) | no. of seeds germinating |
| 10 | 5 |
| 20 | 7 |
| 30 | 9 |
The pupils are encouraged to record the results from their investigation by producing a table of results. The table includes the independent variable (what they were changing) and the dependent variable (what they were measuring). The production of the table of results will help the pupils in constructing a bar chart or graph of their results. An average may need to be taken to get more accurate results. Graphs and charts are powerful tools because they enable pupils to see the result of what they changed (the independent variable) affecting what they measured (the dependent variable). This gives a picture of the information they have collected and helps them to identify patterns and trends. It also helps the pupils to develop understanding by relating pattern and trends to their scientific knowledge. The type of graph that is appropriate depends on the type of variable used for the key variables i.e. what they change (independent variable) and what they measure (dependent variable). The table below shows the types of graphs that should be drawn for different types of variables. |
Step 6 - Recording and Presenting (2)
| What is ... | |||
| ... changed? (independent variable) e.g. | ... measured? (dependent variable) e.g. | Type of table | Type of graph |
WORDS type of cloth | WORDS amount of wear | no graph | |
WORDS type of cloth | NUMBERS size of stain (cm2) | 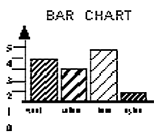 | |
NUMBERS length of pitch of note elastic band (cm) | WORDS pitch of note | no graph | |
NUMBERS concentration of acid (%) | NUMBERS no. of bubbles | 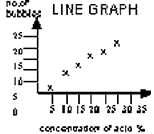 |
Step 6 - Recording and Presenting (3)
| What we measured | |
number of seeds germinating
| |
| temperature (°C) | |
By careful examination of the bar chart or graph, the pupils should be able to identify any trend or pattern that appears in their results. In this case, there is an increase in the number of seeds germinating with increasing temperature. |
Step 7 – Interpreting and Evaluating (1)
| When we increased | temperature (°C) |
| There was ... |
number of seeds germinating
|
| Highlightedan increase in the | |
| a decrease in the | |
| no change in the |
The pupils are now asked to ‘make sense’ of their results. |
Step 7 – Interpreting and Evaluating (2)
| Was the investigation a fair test? | HighlightedYES | NO |
| The conclusion from our investigation is ... | ||
| HighlightedThe number of seeds germinating is controlled by temperature. When you increase the temperature the number of cress seeds germinating increases. | ||
If they are satisfied that the experiment represented a fair test, they may now draw a conclusion from their investigation. If the experiment was not a fair test, no conclusion may be reached. |
Step 8 - Reporting back
After the practical part of the investigation is over, a reporting back session is vital. The importance of this stage is frequently underestimated and sometimes bypassed altogether (although admittedly often because of pressure of time). The reporting back session needs careful handling if the learning outcomes are to be fully achieved. Here the pupils should try to use their own evidence to justify the conclusions at which they have arrived.
The reporting stage can be followed by a ‘consolidation’ stage where the pupils are encouraged to use the information they have gained to further advance their knowledge and understanding. This kind of reflective discussion, where the group outcomes are shared, can be very useful.