
1.1 Minimum inhibitory concentrations
The
The classic test is broth dilution: this is done by doing
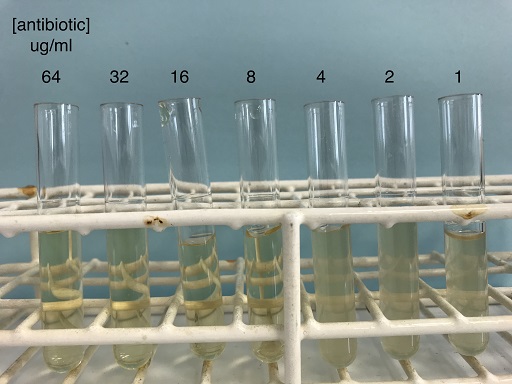
What is the MIC for the antibiotic agent shown in Figure 1?
In Figure 1, visible bacterial growth (turbidity) can be observed in the three tubes containing 4, 2 and 1 μg/ml of antibiotic. The remaining four tubes appear to be clear. At these antibiotic concentrations, visible bacterial growth is inhibited. The lowest concentration where there is no visible bacterial growth is 8 μg/ml; therefore, the MIC is 8 μg/ml.
It is important to note that the MIC of an antibiotic is the concentration at which this antibiotic is bacteriostatic – it stops bacterial growth. However, the test does not show whether there are any viable bacteria still in the suspension. The concentration of antibiotic that kills bacteria is known as the
MICs are used to evaluate the antibiotic efficacy of compounds: the lower the MIC, the less antibiotic is required to inhibit the growth of an organism, so the more susceptible it is. However, the value of a MIC is influenced by the method used to determine it, so MICs are only meaningful if they are compared to other values that were obtained using the same standardised method.
Can MICs be directly compared between antibiotics?
No: the MIC value for one antibiotic cannot be compared to the MIC value of another antibiotic. A lower figure does not necessarily mean the antibiotic will be more effective in practice. This is affected by a range of other factors, such as the achievable tissue concentration, half-life in the blood or whether the antibiotic goes on killing bacteria after the levels in the body have fallen.
MICs are not very useful clinically on their own to predict treatment success or failure. It is therefore necessary to set breakpoints using the MIC. If the MIC of an isolate is below the breakpoint, the organism is considered susceptible. Breakpoints are discussed in the following section.
1 The theory underpinning AST
