

4.1 Non-statistical considerations for determining sample size
There are several non-statistical considerations when determining sample size. Firstly, in most cases, the availability of funding, time and human resources is a fundamental consideration when determining sample size. Secondly, when complete sampling frames do not exist, simple random sampling is impossible and alternative sampling strategies that may require higher sample sizes for equivalent precision are needed.
Most importantly, however, study objectives will ultimately determine the statistical parameters that are acceptable, and certain decisions need to be made before progressing to calculating the required sample size. In studies comparing AMR in one population to another, or temporal trends, one key consideration is the minimum difference that you want to detect. In general, the study should be able to detect the minimum ‘clinically meaningful’ difference. This is a clinical judgement, not a statistical calculation. For example, in a very large study, it might be possible to detect a 1% difference between two groups, but if only a 10% or higher difference would influence clinical practice or be important for public health, then a smaller sample in which a 10% difference can be detected is sufficient. Let’s review an example in Activity 5.
Activity 5: Minimum differences in practice
Figure 3 is taken from a study of AMU over a 12-month period on six cattle farms (labelled A to F) in the United Kingdom (Mills et al., 2018). AMU on farms is of interest to public health because most AMU globally occurs in agriculture, and there is a risk that resistant organisms can be transferred to humans from food animals. Even if your work is not focused on animal health, it is important to be aware of how AMR and AMU are measured and understood across all sectors, given the importance of One Health approaches to combatting AMR.
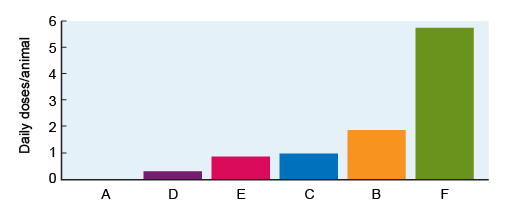
Each farm is represented as a separate bar in Figure 3. AMU is calculated using the
Knowing that Figure 3 represents AMU on six different farms, how might you describe the magnitude of difference in AMU between farms? Which differences might be large enough to be ‘clinically meaningful’? Use the space below to make notes of your conclusions.
Discussion
Figure 3 shows that Farm A reports no AMU, and Farm D reports very little. Farms C and E have very similar AMU, such that the difference between them might not be considered important. By contrast, Farm B has approximately double the AMU of Farms C and E, and AMU on Farm F is approximately six times higher than Farms C and E.
A twofold or greater difference in AMU might have implications for AMR prevention and control, and thus it would be ‘meaningful’ to detect such differences in a study or surveillance programme. In fact, we might consider the ‘minimum’ important difference to detect to be less than a doubling in the amount of AMU. Perhaps we might be concerned about any farm that had, for example, 30% more AMU than Farm D.
4 Sample size calculations
