Use 'Print preview' to check the number of pages and printer settings.
Print functionality varies between browsers.
Printable page generated Thursday, 23 May 2024, 3:41 PM
AMR surveillance in animals
Introduction
Welcome to AMR surveillance in animals. This module is aimed at animal health professionals, including laboratory scientists, veterinary services professionals, policy-makers and data scientists such as epidemiologists.
This module builds on the module Antimicrobial resistance in animals, where we explored in depth the challenge of antimicrobial resistance (AMR) in animals. This module begins by introducing the concepts of surveillance and monitoring, including the different types of surveillance systems and surveillance data. Next, we will consider the purposes of surveillance, and the importance of One Health integration. We will go on to think about surveillance systems in the national context, considering different data sources and the flow of information and feedback. Finally, we will look at how surveillance systems are designed, and the importance of evaluating surveillance. Throughout this module there are opportunities to reflect on how the principles from the module can be applied in your own setting.
Antimicrobials are compounds that kill or inhibit the growth of any type of microorganism. In this module, we will use the term ‘antimicrobial’ to refer to any drug that is active against bacteria, i.e. antibacterial medicines. We include poultry when using the term ‘livestock’, and ‘food-producing animals’ refers to livestock and aquaculture species. We use the term ‘
After completing this module, you will be able to:
- explain the importance of AMR, AMU and residues data when tackling the AMR challenge
- describe and identify the main types of surveillance systems
- explain how local surveillance data is obtained from animals, and the importance of this data in national surveillance networks
- reflect on how your role fits within local and national AMR surveillance networks, and explain the roles of the different stakeholders within the surveillance networks
- explain the purpose of AMR-related surveillance and monitoring in animals, and the importance of conducting surveillance in different groups of animals
- list some of the key points to consider when designing a sampling strategy for AMR surveillance in animals.
Activity 1: Assessing your skills and knowledge
Before you begin this module, you should take a moment to think about the learning outcomes and how confident you feel about your knowledge and skills in these areas. Do not worry if you do not feel very confident in some skills – they may be areas that you are hoping to develop by studying these modules.
Now use the interactive tool to rate your confidence in these areas using the following scale:
- 5 Very confident
- 4 Confident
- 3 Neither confident nor not confident
- 2 Not very confident
- 1 Not at all confident
This is for you to reflect on your own knowledge and skills you already have.
1 AMR/AMU surveillance in animals: main concepts
This section introduces surveillance and monitoring, and recapitulates the concepts introduced in the module Antimicrobial resistance in animals and other introductory modules relating to the types of data used for surveillance of AMR. We will also consider different types of surveillance systems.
After completing this section you will be able to:
- explain the importance of AMR, AMU and residues data when tackling the AMR challenge
- describe and identify the main types of surveillance systems.
1.1 Monitoring and surveillance to address the AMR challenge
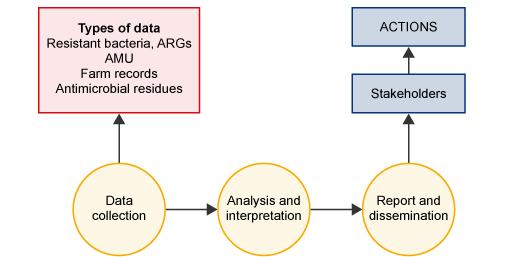
As Figure 1 shows, surveillance is a method of systematically collecting data that can be used by stakeholders to take action by planning and implementing more effective, evidence-based public health policies and strategies relevant to the prevention and control of disease or disease outbreaks. The prompt dissemination of information to those who need to know is as essential as ensuring the quality, validity and comparability of the data.
Surveillance is not in itself a scientific research activity, although some research projects make use of data collected in surveillance systems. Sometimes, surveillance systems in low and middle-income countries (LMICs) are funded or operated by research organisations, which can lead to some confusion between what is surveillance and what is research. The main difference between research and surveillance is that research tries to generate new knowledge, whereas surveillance aims to monitor a known health issue and/or detect emerging health issues.
Surveillance and monitoring are critical components of the response to AMR. They allow for:
- assessing the scale of the AMR problem at a local, national or global level
- measuring patterns of AMR over time in a particular place or places
- informing public health policies on AMU
- improving health outcomes in people and animals.
What are the differences between monitoring and surveillance of AMR?
Monitoring is the continuous effort to collect data to detect changes or trends in the occurrence of AMR in order to inform decisions, such as, implementing mitigation measures. This continuous effort needs to be conducted efficiently.
Surveillance is a special case of monitoring where data are used to assess a status in response to a pre-defined threshold; above this threshold, action needs to be taken. Hence the key difference between surveillance and monitoring is that surveillance results in action being taken if findings indicate a significant change, whereas monitoring does not lead to action.
All surveillance is monitoring, but not all monitoring is surveillance.
Activity 2: Surveillance activities in your professional practice
What surveillance activities are you involved in in your professional setting?
1.2 Types of surveillance
Surveillance systems can be classified as either passive or active, based on how the data are obtained.
These data are obtained when farmers or practitioners send clinical samples to diagnostic laboratories and AMR tests are performed to choose an appropriate treatment. The main reason for generating the data is to improve animal health and profitability of the farmer; however, this system provides data to monitor resistance, and is particularly useful in LMICs where there is a lack of resources needed for active surveillance. Because passive surveillance relies on the voluntary actions of farmers and animal health providers to report the occurrence of disease, the data obtained will be dependent on their motivation and awareness and will contain some degree of bias.
Other types of surveillance
In many countries, the capacity and resources to implement a full-scale surveillance system may not yet be available. In these cases, collecting data through
Activity 3: The surveillance systems in your country
Thinking about the surveillance activities you have identified in your setting, can you think of a surveillance system in food-producing animals, livestock or aquaculture? Is it a passive or active surveillance system?
Discussion
You may want to consider particular activities that you engage with at your workplace that fit with the descriptions in the section above. You may want to discuss this with the lab manager or your supervisor.
Surveillance systems in LMICs are likely to be passive; that is, based on reporting of clinical findings.
Consider the surveillance objectives below and decide whether active or passive surveillance would be most appropriate in each scenario.
Controlling an endemic bacterial disease in animals or fish
Active surveillance would be most appropriate in this scenario, because activities can be designed to target the specific endemic disease that that you wish to control within a population.
a.
Active surveillance
b.
Passive surveillance
The correct answer is a.
Monitoring changes in trends of AMR in animals.
Passive surveillance would be most appropriate in this scenario, because you are interested in general trends rather than a specific target species or resistance type, but it requires farmers and veterinarians to regularly submit samples to laboratories. Designing an active surveillance system to monitor general trends in AMR would require a lot of resources.
a.
Active surveillance
b.
Passive surveillance
The correct answer is b.
Investigating the public health risk of AMR E. coli in meat products.
Active surveillance would be most appropriate in this scenario, because activities can be designed to target the products and organism of interest in order to investigate the risk to public health.
a.
Active surveillance
b.
Passive surveillance
The correct answer is a.
Detecting the emergence of novel types of resistance among bacterial pathogens.
Passive surveillance would be most appropriate in this scenario, because there is no specific target and data would be obtained following the reported occurrence of disease. This would be an example of early warning surveillance.
a.
Active surveillance
b.
Passive surveillance
The correct answer is b.
1.3 AMR surveillance data
1.3.1 Types of AMR surveillance data and their uses
AMR surveillance can involve collecting various types of data. Table 1 shows the different types of data that can be obtained in animal production systems (previously introduced in the module Antimicrobial resistance in animals). The different types of data provide different information about how to address AMR and consequently have different uses.
| Type of data | Point of data collection | Sources | Information uses | |
|---|---|---|---|---|
| Resistant bacteria and | Farms | Diseased animals | Clinical samples: animal faeces, milk, fish, etc. | Control animal diseases |
| Healthy animals | Pooled samples of faeces, bulk milk, fish, pond water | Understand transmission dynamics of AMR emergence, sources of AMR, trends, transmission | ||
| Feed mill | Feed | Investigate contamination of feed with bacteria, e.g. Salmonella spp. | ||
| Food chain, post-harvest: abattoir, markets, retail | Products: meat carcasses and products, bulk milk, eggs, fish | Understand dynamics of pathogenic and commensal AMR bacteria, transmission; risk to public health | ||
| Environment: manure tank, water sources, pond | Water, soil, manure | Understand dynamics of AMR transmission | ||
| AMU data | Farm | Records: AMU | Assess AMU and understand its effect on AMR | |
| AMC data | Industry, customs | Records of sales and imports data | Proxy for AMU data | |
| Antimicrobial residues data | Farm | Animal products, such as milk | Compliance with withdrawal periods | |
| Food chain | Animal products: carcasses, milk, eggs, fish | Compliance with export requirements | ||
| Environment | Water, manure, sediment, soil | Understand dynamics of AMR transmission | ||
The types of data described in Table 1 are useful in themselves, but can also be combined to provide information that is more valuable. For example, data on the prevalence of resistant bacteria present on a farm could be analysed alongside AMU records to look at the impact of AMU on AMR. Another approach would be to compare data from different sample types, such as manure from poultry farms and pond water, and sediments from fish farms, to explore possible transmission of resistant bacteria.
1.3.2 Metrics of AMU
To compare quantitative data reported on antimicrobial agents intended for use in animals between regions and over time, a standardised measurement is needed that accounts for the fact that animal populations vary in size and composition. There is a consensus in the scientific community that a relative measure is needed, where the amount of antimicrobial (the numerator) is divided by a denominator that summarises the population at risk of being treated.
These can be weight-based metrics (e.g. mg or kg of active ingredient) or dose-based metrics (e.g. DDD). Data to estimate weight-based metrics are more often available, being a more accessible option for AMU monitoring at a worldwide level, whereas dose-based metrics provide a more accurate metric (Moreno et al., 2020).
Activity 4: Types of surveillance data and sources
Imagine a scenario where you would like to investigate the presence of resistant bacteria in a food production system and establish a baseline prevalence.
- Which type of surveillance systems would you choose?
Answer
- Active surveillance; specifically, sentinel surveillance if there are limited resources.
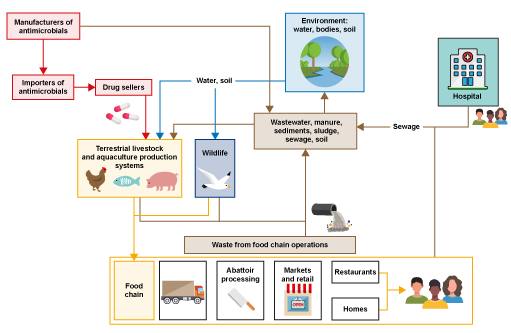
Look at the system in Figure 2. This is a general representation of a food production system illustrating the many different connections between drug providers (shown in red), farms (terrestrial livestock and aquaculture production systems) and following parts of the food chain (shown in yellow), the environment (shown in blue) and waste from food chain operations and human health (hospitals (shown in brown) This illustrates the central role of the environment in these types of systems.
- Which type of data could be useful to investigate prevalence of resistant bacteria in animals and where it could be collected?
- Identify the points in the system to obtain other, different types of AMR surveillance data. Can you think how these data could be useful in combination?
Answer
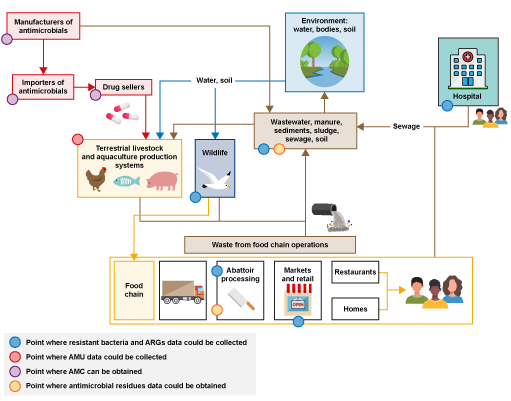
Figure 3 is an annotated version of Figure 2 that highlights points where different types of AMR surveillance data could be collected.
The first type of data you could collect is on the presence of resistant bacteria. Samples to detect resistant bacteria could be collected on farms, at abattoirs, at markets, from wildlife, in hospitals and primary care, and from the surrounding environment. These are illustrated by the blue dots in the amended figure.
Another type of data you could collect to complement the data on resistant bacteria is AMU data at farm level, as indicated by the red dot in Figure 3. AMU data would be useful to understand the potential role of AMU on resistance profiles collected from livestock present on the farms where samples were collected.
Data on AMC in animals could be collected from the pharmaceutical industry, such as drug sellers and pharmacies, as illustrated by the purple dots in Figure 3.
Data on antimicrobial residues could be obtained through sampling at abattoirs or in the environment, as illustrated by the yellow dots in the Figure 3, which could be compared to data on AMU in farms, to verify that the products reported match the substance identified.
2 Purposes of AMR/AMU surveillance and monitoring in animals
In this section we will consider why surveillance is conducted. You will be introduced to the purposes of AMR/AMU surveillance in animals, and the importance of conducting and integrating surveillance in different animals and humans. These aspects will be further expanded and referred to in Sections 3 and 4.
After completing this section, you will be able to explain the purpose of AMR surveillance and monitoring in animals, and the importance of conducting surveillance in different groups of animals.
2.1 Purposes of AMR surveillance and monitoring in animals
There are many reasons why we may want to conduct surveillance. The purpose of a surveillance system describes why it is necessary and what it will accomplish. Surveillance activities should be designed for a specific purpose.
There are different ways to classify the various purposes of surveillance systems. Figure 4 is based on the terrestrial and aquatic animal health codes (OIE, 2019) which suggests six classifications of surveillance purposes – numbered in the figure – based on what surveillance will accomplish.
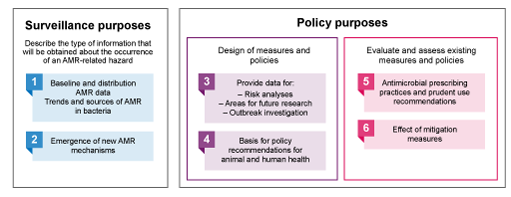
In addition, the RISKSUR consortium – a group of European experts in animal health surveillance, part of a project called Risk-based Animal Health Surveillance Systems – described the purposes as either a
2.2 Benefits of surveillance
To understand the benefits of surveillance, it is useful to consider:
- the source of the data (food-producing animals, food animal products, feed or environment)
- the bacterial target or focus of the investigation (pathogenic bacteria for the animal; commensal and zoonotic bacteria)
- the scope of the surveillance (farm level, national, industry or environment).
2.2.1 Benefits to animal health and welfare
Surveillance activities of resistance in pathogens in food-producing animals will generate evidence to inform the control of bacterial diseases, and have benefits for animal health and welfare. This can be at the farm level, and benefit the farmer, but it could also be as part of a national surveillance programme to control a disease, which could also benefit the industry. An example of this can be a control programme to address mastitis caused by methicillin-resistant Staphylococcus aureus (MRSA). These kinds of surveillance activities are passive, relying on the submission of clinical samples from the farmers or practitioners.
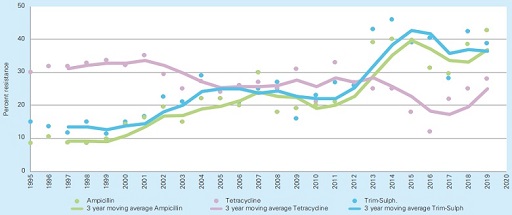
For example, the monitoring of resistance in Escherichia coli from pigs with diarrhoea in Sweden (Figure 5) showed that multidrug resistance to ampicillin and trimethoprim-sulphamethoxazole increased from 20 to 42% in the last years (Aspevall et al., 2020). This type of data is also used to inform prescribing practices and recommendations, such as to support the routine susceptibility testing in cases of diarrhoea before administering the antimicrobial. The effect on the prevalence of resistance has not yet been reported.
2.2.2 Benefits to public health
AMR surveillance activities can also have a public health benefit, if the focus is foodborne pathogens and zoonotic bacteria in animals. As explained in the module Antimicrobial resistance in animals, zoonotic bacteria are transmitted between animals and humans, and cause infection in humans. These can be commensal bacteria in animals, so surveillance activities need to target healthy animals at the farm or abattoir, and animal products in the food chain.
In Sweden, there is active
Also in Sweden, clinical E. coli isolates from passive surveillance in animals and humans are compared to identify potential common resistance. Challenges were described in these systems due to the different type of cut-off value used. Data for bacteria from humans are interpreted with
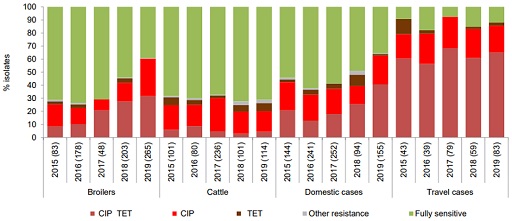
In Denmark, the Danish Integrated Antimicrobial Resistance Monitoring and Research Programme (DANMAP) includes surveillance of Campylobacter spp. and non-typhoidal Salmonella spp. with the aim of establishing trends and sources of resistance. The system collects information from chicken, cattle and humans. More details on the characteristics of surveillance can be found in the DANMAP report (Korsgaard et al., 2020).
Figure 6 shows resistance profiles of Campylobacter jejuni across the different species, comparing the distribution of resistance. Some noticeable features include the following:
- The highest percentage of resistant C. jejuni isolates to both ciprofloxacin and tetracycline was from humans returning from overseas.
- The percentage of resistant C. jejuni to both ciprofloxacin and tetracycline has increased in broilers and human domestic cases in the last years.
- In cattle, the main resistance found was to ciprofloxacin. It is important to note that fluoroquinolones (which include ciprofloxacin) have not been used in Denmark for animal production for ten years.
Whole genome sequencing from the isolates was applied only to human isolates that allowed the investigation of a nationwide outbreak due to a common C. jejuni clone resistant to ciprofloxacin, nalidixic acid and tetracycline. However, establishing the role of outbreaks in general resistance trends remains a challenge.
2.2.3 Monitoring indicator bacteria from healthy animals
Now let’s look at monitoring
E. coli and Enterococcus spp. can serve as indicators of resistance in an animal population because they:
- are present as commensals in the gut microbiota of healthy animals and humans
- can acquire AMR both via mutations in chromosomal genes and horizontal transfer of ARGs
- have the potential to cause infections in both animals and humans, and to transfer AMR to pathogenic bacteria of the same or other species.
Monitoring the prevalence of acquired resistance in such commensal bacteria can indicate the magnitude of selective pressure from the use of antimicrobials in an animal population.
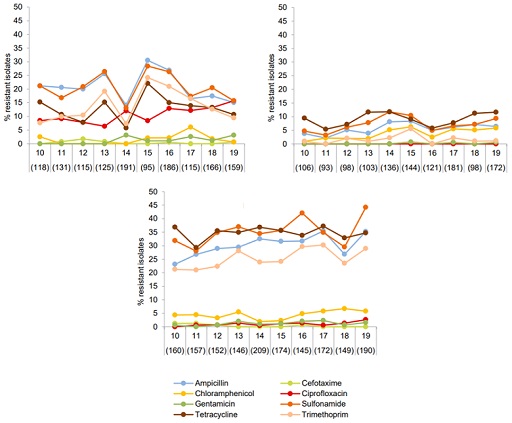
For example, monitoring resistance in indicator bacteria such as E.coli has been conducted in Denmark since 2010 in broiler chickens, cattle and pigs. Figure 7 shows that the occurrence of ampicillin, sulfonamide, tetracycline and trimethoprim resistance was significantly higher in E. coli from pigs compared with isolates from cattle and broilers. In contrast, resistance to ciprofloxacin in isolates from broilers (red in the figure) was higher than in isolates from cattle and pigs, and it continues a slow but increasing trend. All antimicrobials in the figure are also used in human health.
This information has been used to assess the zoonotic risk linked to transfer of resistance to critically important antimicrobials from animals to humans. You can read more about the interpretation and usefulness of data in Section 7.2.2 of the DANMAP report (Korsgaard et al., 2020). This information is routinely compared to reports from other EU member states to understand the trends.
2.2.4 Understanding the epidemiology of AMR
As explained in the Antimicrobial resistance in animals module, resistant bacteria from animal systems can be transmitted indirectly to the environment through water sources, manure and soil, and can be accumulated or transmitted to other animal populations. Similarly, resistance present in the environment can also be transmitted to farm animals.
Surveillance activities targeting the environment and wild animals are needed to be able to establish baseline data, sources of resistant bacteria or hotspots to be regularly monitored, and identify where interventions can be implemented to reduce the risk of AMR in humans, animals and the environment. For example, AMR surveillance has been conducted in wild animals in Sweden to investigate the source of strains of MRSA, which has been described in the human population in other countries in Europe (Bengtsson et al., 2017).
Establishing baseline data and monitoring AMU in animals would allow for the production of improved prescribing and prudent use guidelines that can lead to a reduction of AMU in animals, and further reduce the risk of development of resistant bacteria in animals and humans. Currently the information that is reported refers to antimicrobial consumption, as explained in Section 1.3.1. This data is also useful for the national and global level because it can:
- provide information on trends and the type of antimicrobials used
- inform policies
- be compared to data from the human sector.
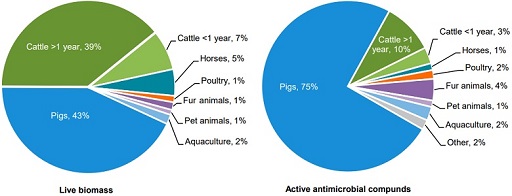
Figure 8 shows the distribution of consumption of antimicrobials by animal species in Denmark compared to the live biomass, as the mass of the species. The pig and cattle sectors present the highest biomass, as the weight of living organisms of a species (43% and 39% respectively), but the pig sector was reported to use 75% of all veterinary prescribed antimicrobials in animals in Denmark. This is due to the large amount of production and consumption of antimicrobials. Cattle present a comparable biomass: the majority of cattle consists of dairy cows, which have low consumption of antimicrobials in Denmark.
In Denmark, all antimicrobials are available on prescription only. Data on all sales of veterinary prescription medicine from the pharmacies, private companies, feed mills and veterinarians are sent electronically to a central database called VetStat, which is hosted by Danish national authorities.
Before 2001, available data was antimicrobials sales derived from pharmaceutical companies. In addition, the national action plan (NAP) against AMR set several goals, including the reduction of AMU. To achieve this, a Yellow Card initiative was implemented in 2010, mainly targeting pig farmers as the bigger users, using surveillance at herd level, and establishing threshold values for AMU in individual herds. Legal action would be taken against farmers with high AMU. Decreased AMU was observed in the following year. It is important that this measure is complemented by health management at the farm to prevent diseases.
If you are interested to know more about potential legislation in the last 20 years in Denmark, visit Section 4.1 of the DANMAP report (Korsgaard et al., 2020). An FAO report includes lessons learnt from this process (FAO/Denmark Ministry of Environment, 2019).
Activity 5: Reflecting on the uses of surveillance data
- Why do you think that it is important that surveillance data are used to inform policy recommendations and evaluate practices?
- What sort of outcome and interventions might analysis of AMR surveillance data lead to?
Answer
- It is important to use surveillance data to inform policy recommendations in order to support the planning, development and implementation of policies to mitigate the impact of AMR. Surveillance data should enable the relative importance of different threats to be assessed in relation to public health, animal health and welfare, trade or wider society.
- Analysis of AMR surveillance data may lead to the identification of new resistance patterns or early recognition of important trends to inform risk management policies. It can allow for communication of information on prevalence, incidence and trends of resistance to those with an interest at the regional, national or international level. It can facilitate international trade in live animals and animal products by meeting international obligations, and allow the efficient allocation of resources for AMR surveillance, control and research.
2.3 One Health integration of AMR surveillance
One Health integration in existing AMR surveillance systems
A recent study reviewed AMR surveillance systems reported in the scientific literature that analysed and reported prevalence or incidence data periodically since 2007 (Diallo et al., 2020). Up to 71 surveillance systems were identified from 35 countries worldwide. Of these 71 surveillance systems, 53 targeted AMR in humans, 12 targeted AMR in humans and animals, and six exclusively targeted AMR in animals. These included monitoring bacteria of zoonotic origin, including Campylobacter spp., Salmonella spp. and commensal bacteria (E. coli).
Among the 12 surveillance systems that targeted AMR in humans and animals, the review identified a few examples of integrated animal and human AMR surveillance, available in Canada (CIPARS), Denmark (DANMAP), the Netherlands (MARAN) and Sweden (The Public Health Agency of Sweden 2020). But overall, One Health integration in AMR surveillance is lacking.
The value of One Health integration
Integrated surveillance systems built on a One Health approach provide a more complete picture of AMR and AMU. Depending on the objective and its design, they can facilitate analyses of trends over time and space, and of relations among sectors. More details are provided in the module Introducing a One Health approach to AMR.
Integration ideally works in multiple dimensions, within and among sectors and levels, including vertical alignment within public health initiatives and horizontal coordination among strategies for human and animal health, food production (animal and plants) and may involve relevant aspects of plants and the environment. In practice, integration is more likely to be a ‘mosaic’ within and among sectors, as the production systems in the animal and plant sectors are widely diverse, and their products are used in many different industries. For example, the animal sector alone comprises more than 50 sectors, including dairy, poultry, meat and crustaceans (IACG, 2018).
Activity 6: The AMR country progress tool
In this activity you are going to familiarise yourself with the AMR country progress tool, which provides data from individual countries’ self-assessment regarding different aspects of AMR, such as whether they have a NAP or surveillance systems.
On the left-hand side of the tool, select ‘2019-20’ for survey year, and select ‘4.1: Multi-sector and One Health collaboration/coordination’ as the question. This first question relates to the level of collaboration/coordination in the countries.
Each country is classified according to the level of multi-sector and One Health integration that occurs using a five-point scale, from A (no formal multi-sectoral governance or coordination mechanism on AMR exists) to E (integrated approaches used to implement the AMR NAP with relevant data and lessons learned from all sectors used to adapt implementation of the action plan).
The next six questions (4.2.1–4.2.6) relate to whether specific sectors are actively involved in developing and implementing the AMR NAP.
- What level of multi-sector and One Health collaboration/coordination occurs in your county?
Answer
The answer will depend on your country. Countries are colour-coded based on their answer, which is grouped into one of five categories:
- A.(red) – no formal multi-sectoral governance or coordination mechanism on AMR exists
- B.(orange) – multi-sectoral working group(s) or coordination committee on AMR established with government leadership
- C.(yellow) – multi-sectoral working group(s) is/are functional
- D.(light green) – joint working on issues including agreement on common objectives
- E.(dark green) – integrated approaches used to implement the AMR NAP with relevant data and lessons learned from all sectors used to adapt implementation of the action plan.
- What sectors are involved in developing and implementing the NAP in your country? Use the ‘question’ box to change the question to questions 4.2.1–4.2.6 and see whether these different sectors are actively involved in developing and implementing the AMR NAP in your country.
Answer
This could be human health, animal health, plant health, food production, food safety and environment. Changing the question to questions 4.2.1–4.2.6, you can see whether or not these different sectors are actively involved in developing and implementing the AMR NAP in your country. Countries are colour-coded based on their answers to these questions: yes (blue), no (red) and no information received (grey).
3 Surveillance systems in the national context
In this section, you will learn about the flows of information in national surveillance systems.
After completing this section you will be able to:
- explain how local surveillance data is obtained from animals, and the importance of this data in national surveillance networks
- reflect on how your role fits within local and national AMR surveillance networks, and explain the roles of the different stakeholders within the surveillance networks.
3.1 Data sources
The first point in a surveillance network is the data source. As explained in Section 1, there are several different types of data that can be collected for AMR surveillance, and these can be collected from a variety of sources. For example, local AMR surveillance data from animal systems can be obtained from biological samples and from records or surveys.
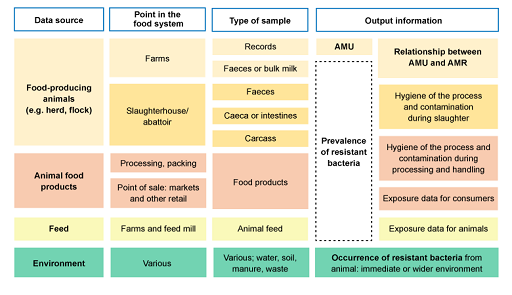
Figure 9 outlines information adapted from the active surveillance systems of AMR in food-producing animals (OIE, 2019). The figure shows the relationship between the sampling source, point in the food system where the sample can be obtained, which type of sample and what information is obtained.
For example, if the data source is food-producing animals, data can be collected at the farm, or post-harvest at the abattoir. Samples that could be collected on farms include AMU records or biological samples such as faeces or bulk milk. This can provide information on AMU, prevalence of resistant bacteria and the relationship between AMU and AMR.
Some considerations:
- Figure 9 only refers to the sources of data to investigate resistant bacteria and AMU in healthy food-producing animal populations. This would be relevant to investigate commensal and zoonotic foodborne bacteria that are a threat for public health.
- Clinical samples from animals could be a source of data for passive surveillance of animal pathogens. This would be of interest for the countries to address infectious diseases.
- The same sources of data outlined could be tested for the presence of antimicrobial residues. In the case of food-producing animals (such as testing the milk), this would provide an indication of recent treatment with antimicrobials or lack of compliance with the withdrawal period.
- What would be the value of interpreting this AMR information with information on AMU from the farm, and comparing results from residue testing from the food chain with AMU data?
- Comparing data on AMR and AMU can allow us to establish whether there is a relationship between the use of antimicrobials and occurrence and/or prevalence of resistance in bacteria, and measure the strength of this association.
- Comparing data on residues and AMU can provide more information on what is actually used on a farm. For example, if we detect residues in meat of an antimicrobial that is not found during an AMU survey, this tells us that there may be gaps in our AMU data, or that animals are being exposed to antimicrobials via alternative routes, such as the environment.
- What would be the value of interpreting data from different sources, such as other food-producing animal systems?
To understand interactions between different systems. For example, if data from an aquaculture system demonstrate high prevalence of resistance among bacteria, but we know that that antimicrobial is not used in fish, data on AMU and AMR in poultry farms nearby or from which faeces are used to fertilise the ponds may help us to identify, and control, the potential cause of occurrence of resistance in bacteria carried by fish.
3.2 The flow of samples, information and feedback
Surveillance data can have different uses at the individual, group, national or global level, which should correspond with the purpose of the surveillance systems.
For example, at the individual and farm level, in animals with disease, data can be utilised to improve animal health by informing treatment decisions (i.e. choice of therapy). When individual or group-level data are aggregated and analysed at local and/or national level, they can inform prescribing guidelines and identify key actions.
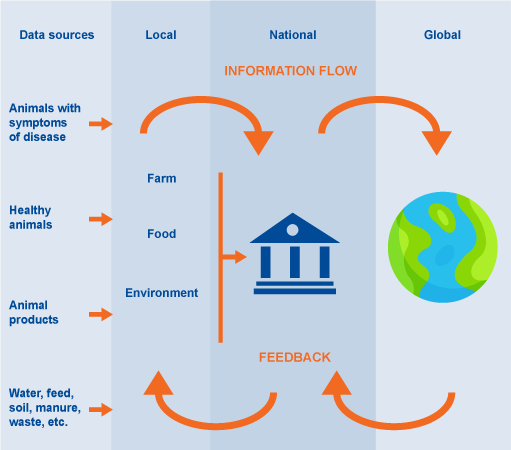
Figure 10 shows the general flow of information in the surveillance systems. It starts in the data sources, explained in the previous section, as part of the local surveillance. The information needs to be reported nationally and globally, to address the AMR challenge.
To summarise:
- at the individual or group level, surveillance data allow veterinary and animal health professionals to make better informed clinical decisions to ensure better animal health outcomes
- at the national level, surveillance data guide policy and ensure appropriate and timely animal health and public health interventions
- at the global level, surveillance data could provide early warnings of emerging threats and data to identify and act on long-term trends.
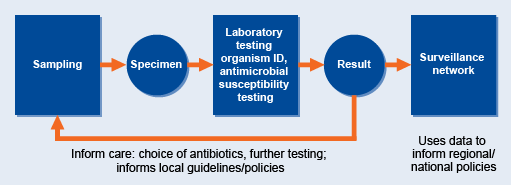
Local surveillance is the cornerstone of AMR surveillance. Figure 11 shows the journey of the sample, from sampling to the surveillance network, and points where decisions are taken. Data collected by local surveillance sites are reported and collated to provide a national overview of AMR.
Local surveillance comprises six broad task areas, all of which are critical for good quality data:
- collecting/receiving specimens and logging specimen and relevant clinical information
- performing tests
- monitoring and documenting data
- interpreting data
- reporting and communicating test results to the person submitting the test
- reporting and communicating results/data beyond the laboratory (local/national/global).
Activity 7: The flow of information and feedback
In this activity you will consider how AMR surveillance in animals works in your country. You can consider the country in general, or focus on a specific scenario that you are familiar with, such as AMR surveillance in poultry, fish or meat products.
Use a piece of paper to draw a diagram of the connections among stakeholders, flow of information and feedback – to support your thinking.
- Explain the flow of information in the AMR surveillance system through each of the surveillance activities: data collection, data validation, data analysis and interpretation, dissemination and reporting.
- Is there feedback of information? What type of feedback and where?
Answer
- You may find that there are some gaps in the flow of information, or that the surveillance activities in your system follow a slightly different flow. This is usual, and may highlight where improvements could be made. You may want to discuss this with your supervisor.
- This could be to farmers, senior colleagues, policy-makers or the wider scientific community in published reports. Information may be used at the local, national or global level.
3.3 The role of the animal health stakeholders
As explained in the module AMR surveillance and you, the responsibility for AMR surveillance is distributed across various professional roles. The next activity aims to provide you with an opportunity to reflect on your role and responsibilities in relation to the surveillance activities.
Activity 8: The role of the animal health stakeholders
Think about the surveillance activity you are involved in: for example, it could be data collection, data validation, data analysis and interpretation, reporting or dissemination of surveillance results and information.
Use the information from Activity 7, where you identified the journey of the sample, flow of information and feedback.
- Can you identify the main stakeholders and institutions conducting the surveillance activities? You can think of people and organisations involved in data collection, data analysis and interpretation, dissemination of information, provision of feedback, decision-making, etc.
- What is your role? What are your responsibilities? Is it a local or national role?
- Which other professionals do you interact with from the animal health sector and human health sector? What information do you share? Do you share results or take joint decisions?
- Who plays a role in communication and dissemination of information?
- Do you provide or receive feedback of results?
- What do you think are the barriers to integration of surveillance across sectors?
Discussion
Your answers will be specific to your setting. You might have thought about professionals you interact with who might depend on your role. (For question 6, potential problems in some systems could include a lack of time to discuss information with other professionals, lack of communication channels to other professionals (such as human and veterinary clinicians), language barriers, and differing priorities and ways of working.)
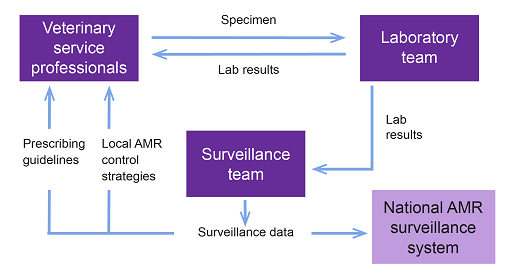
Similarly, you might be in charge of analysing samples, and know that the purpose is to detect or understand trends, but other animal health stakeholders can be communicating information to farmers, designing policies, or conducting risk analysis, or will only use the data to assess actions.
Figure 12 might help you to reflect on the connections in your setting. It is only a generic representation of the connections between the stakeholders involved in surveillance, such as the veterinary service professionals, laboratory team or surveillance team, and it shows the information they exchange and the direction of the information. This might be different in your setting.
Consider each of the stakeholders below and select the most appropriate role they play that contributes to the surveillance network.
Diagnostic laboratory staff
Data scientists and epidemiologists
Veterinary services or animal health professionals
Policy-makers
a.Documenting clinical information, collecting samples, providing feedback and advice to the farmer on what treatment is needed or should be avoided
b.Deciding which interventions need to be prioritised to minimise AMR risks
c.Performing tests
d.Analysing, interpreting and reporting data
- 1 = c
- 2 = d
- 3 = a
- 4 = b
Using the following two lists, match each numbered item with the correct letter.
4 Design of surveillance and monitoring programmes
In this section, you will be introduced to the principles of designing AMR surveillance and monitoring in animals.
Before we begin, what do you think are the key points to consider when designing a sampling strategy for AMR surveillance in animals?
4.1 Overview of surveillance design
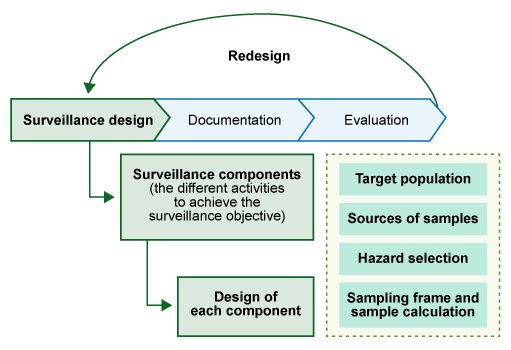
We will start by looking at an overview of the key points that you need to consider when designing a surveillance strategy. These are outlined below, and in Figure 13:
- Surveillance purpose: Why do we need to do the surveillance? What is the overall aim?
- Surveillance system: What is the most appropriate type of surveillance system to use to achieve our surveillance purpose?
- Surveillance objective: What are the goals we need to achieve to meet the purpose of our surveillance?
- Surveillance components: What activities will our surveillance system include? (Elements for the design of a surveillance components are explained in Section 4.3.)
- Documentation: How will we document our surveillance system?
- Evaluation: How will we evaluate our surveillance system?
4.2 Surveillance objectives
Surveillance objectives are the goal(s) that, when met, will result in the collection and analysis of data in order to achieve the purpose of the system. Objectives in animal health surveillance could include the following:
- Prevalence estimation (of resistance in a given bacterial species): This is the most common objective in AMR surveillance in animals. It is needed to be able to establish baseline data and monitor trends.
- Early detection: To detect the emergence of new resistance patterns and/or mechanisms – this may be through sentinel surveillance or syndromic surveillance.
- Case detection: This may be adequate to calculate the number of units needed to be tested to detect cases of antimicrobial residues in export products.
- Freedom from disease: This may be a relevant objective in countries that are trying to eliminate a particular type of resistant bacteria, such as MRSA.
4.3 Designing a surveillance system
4.3.1 Surveillance components
When designing a surveillance system, we need to consider what activities are required to pursue the surveillance objective. These activities are known as surveillance components.
A
A
A
Surveillance components included in national AMR surveillance systems can be:
- statistically based surveys
- sampling and testing of food-producing animals on the farm, at live animal markets or at slaughter
- an organised sentinel programme, for example targeted sampling of food-producing animals, herds, flocks and vectors (such as birds or rodents)
- analysis of veterinary practice and diagnostic laboratory records
- sampling and testing of products of animal origin intended for human consumption
- sampling and testing of feed ingredients or feed.
4.3.2 Designing surveillance components
There are some essential surveillance design elements that must be considered when designing surveillance of AMR in animal systems:
Target (reference) population
This is the population to which the results will be extrapolated; for example, to all commercial broiler farms in a country.
To identify the target population, countries should prioritise the populations that will best serve the purpose, considering the available resources. Countries should consider which sources are likely to contribute most to a potential risk to animal and human health. It would be helpful to consider the main food-producing species and the consumption level, foodborne infections and AMC.
For example, in the protocol for active AMR surveillance in commercial broilers and layers chicken population (McKenzie et al., 2019), poultry species were selected due to the high global consumption level, foodborne infections and reported AMC.
Sources of samples
As illustrated throughout this module (and specifically outlined in Section 3.1), samples should be taken at different points of the food system, depending on the information needed, based on the surveillance objective and purpose.
For example, if the aim to establish baseline data about the prevalence of resistant foodborne pathogens, sampling the food chain might be a priority. If the interest is in an indicator bacterium, such as E. coli, data from different points in the system, including farms, food chain, hospitals and environment, might be advisable to subsequently compare and integrate the results across sectors.
You can find illustrations of examples to reflect on the sources of samples in Section 2.2.
Sampling frame and sample calculation
(This is more extensively developed and illustrated in the module Sampling (animal health).)
The
Each country can choose to develop or identify an appropriate sampling frame for its identified target population. This can be a list of farms, slaughterhouses or other sources suitable for sampling. For example, in a poultry farm, the epidemiological unit could be the flock, as an enclosed group of the same health status; in a fish farm it could be the pond, but there should be consideration if ponds are connected and could act as a sole unit, as bacteria could be transmitted through the water.
- The sample should avoid
bias , which is a systematic error due to the design, implementation or analysis of the surveillance system. Bias is reduced as representativeness is increased. - The sample should be
representative of the animal population, process, product or other unit of interest whilst taking into account the expected prevalence of the bacteria in the sample type, the expected prevalence of the resistance phenotype and the desired level of precision and confidence. - The sample size calculation should be based on independent samples. However, if there is any
clustering at the establishment or animal level, the sample size (and analysis) should be adjusted accordingly. For example, if samples are taken from the same farm or market vendors, this would result in a bias, and thus it should be adjusted in analysis and interpretation. - At low levels of expected prevalence, exact methods of sample size calculation should be preferred to approximate methods.
- Samples from which bacteria were not isolated cannot be used in the calculation of prevalence of the resistance phenotype within that bacterial population.
The FAO recommends that ‘80% of the total target population should be included in the sampling frame from which the actual samples will be drawn’ (FAO, 2019), which is something that can be challenging to achieve in LMICs. The recommendations are that:
- findings and conclusions should be limited to the nature of samples and the sampling strategies taken
- statistically valid surveys achieving appropriate representativeness and fulfilling the desired objectives of the AMR surveillance as set out in the plan should continue to be pursued progressively by each and every country.
Hazard selection refers to bacterial species to be monitored, and it could also refer to specific ARGs and antimicrobial residues. (See the module Antimicrobial resistance in animals for more information on resistant bacteria, ARGs and antimicrobial residues.)
A
- Escherichia coli
- Salmonella spp.
- Enterococcus faecium and E. faecalis
- Campylobacter spp.
These bacteria represent a combination of commensals and foodborne zoonotic pathogens, and are carried by all animals. (See the module Antimicrobial resistance in animals for more information.)
In addition, in the design of a surveillance component and subsequent documentation, there are other elements to consider that will be covered in depth in other modules. These include the following:
- Bacterial storage, where isolates should be preserved at least until reporting is completed. Preferably, appropriate isolates should be permanently stored. Bacterial strain collections, established by storage of all isolates from certain years, will provide the possibility of conducting retrospective studies.
- AST – this is discussed in more detail in the module Antimicrobial susceptibility testing.
- Recording, storage and interpretation.
If you are interested in learning more about how to design surveillance activities and practical examples, you might like to read the following sources at some later date:
- The full criteria to be considered in OIE codes Harmonisation of National Antimicrobial Resistance Surveillance and Monitoring Programmes (OIE, 2019) in the terrestrial animal health code and the aquatic health code.
- Applied guidance in an FAO report on monitoring and surveillance of AMR (FAO, 2019).
- Examples of One Health surveillance to understand how to apply the main points explained in this section (McKenzie et al., 2019).
- ‘A 12-point checklist for surveillance of diseases of aquatic organisms: a novel approach to assist multidisciplinary teams in developing countries’ (Bondad-Reantaso et al., 2021).
4.4 Evaluation of surveillance
The capacity of surveillance systems to accurately describe patterns of diseases is of public health importance.
A surveillance programme or activity might be adequate and effective at its initial design and implementation. However, the context changes over time and new discoveries may have been made within laboratory or data capture methods. Similarly, changes in disease epidemiology, demography or clinical treatment practices and opportunities may have happened. Additionally, resources may diminish and priorities change making cost- effectiveness more important. In other words, the surveillance programme may no longer be fit for purpose.
Therefore, regular and relevant evaluations of these systems are critical in order to improve their performance and efficiency.
Evaluation is defined as the ‘systematic and objective assessment of the relevance, adequacy, progress, efficiency, effectiveness and impact of a course of actions, in relation to objectives and taking into account the resources and facilities that have been deployed’ (Drewe et al., 2015). The importance of surveillance evaluation was highlighted by a project undertaken in the UK by the Royal Veterinary College, Animal and Plant Health Agency, and Scottish Agricultural College. This project generated a novel SuRveillance EVALuation framework (SERVAL), which was designed to be generic so that it can be used to evaluate any animal health surveillance system (Drewe et al., 2015).
The key steps within the framework are as follows:
- Define the scope of the evaluation.
- Characterise the surveillance system to be evaluated.
- Design the evaluation.
- Conduct the evaluation.
- Reporting and communication.
If you are interested to know more about evaluation of surveillance, you may be interested to explore a case study in your own time (Drewe et al., 2017).
Activity 9: Reflecting on the different components of a surveillance system
Thinking about the surveillance system you are most familiar with in your setting, identify and write down the systems components, as defined in Section 4.3.1. Could you identify the target population and the sample source?
Discussion
There may be a single component, or there may be several. Look back at the examples of components provided in Section 4.3.1 to help you identify the components in your system.
What type of surveillance component would be most appropriate for each of the following objectives?
Statistically based surveys
Organised sentinel programme
Analysis of veterinary practice and diagnostic laboratory records
Sampling/testing products of animal origin intended for human consumption
a.Detecting the occurrence of resistance to colistin among E. coli in pigs.
b.Ensuring that food products meet export requirements for maximum residue levels.
c.Estimating the prevalence of cattle farms harbouring E. coli with resistance to ESBLs.
d.Detecting new or emerging types of resistance based on treatment failures.
- 1 = c
- 2 = a
- 3 = d
- 4 = b
Statistically based surveys can provide a quantitative estimate of prevalence within the survey population.
In an organised sentinel programme, repeated surveillance in the same species is required.
Analysis of veterinary practice and diagnostic laboratory records allows for the detection of resistance among clinical isolates to provide an early warning of new or emerging types of resistance.
Sampling/testing products of animal origin intended for human consumption ensures that any products not meeting the requirements are identified and removed from the food chain.
Using the following two lists, match each numbered item with the correct letter.
5 End-of-module quiz
Well done – you have reached the end of this module and can now do the quiz to test your learning.
This quiz is an opportunity for you to reflect on what you have learned rather than a test, and you can revisit it as many times as you like.
Open the quiz in a new tab or window by holding down ‘Ctrl’ (or ‘Cmd’ on a Mac) when you click on the link.
6 Summary
In this module you have learned the main types of surveillance systems. You have learned the different purposes of surveillance and their importance. You have explored the process of obtaining local surveillance data and reflected on your role and responsibilities. You have been introduced to the main elements to consider when designing a sampling strategy for AMR surveillance in animals. Throughout the module you have had opportunities to reflect on AMR in an animal industry setting relevant to you.
You should now be able to:
- explain the importance of AMR, AMU and residues data when tackling the AMR challenge
- describe and identify the main types of surveillance systems
- explain how local surveillance data is obtained from animals, and the importance of this data in national surveillance networks
- reflect on how your role fits within local and national AMR surveillance networks, and explain the roles of the different stakeholders within the surveillance networks
- explain the purpose of AMR-related surveillance and monitoring in animals, and the importance of conducting surveillance in different groups of animals
- list some of the key points to consider when designing a sampling strategy for AMR surveillance in animals.
Now that you have completed this module, consider the following questions:
- What is the single most important lesson that you have taken away from this module?
- How relevant is it to your work?
- Can you suggest ways in which this new knowledge can benefit your practice?
When you have reflected on these, go to your reflective blog and note down your thoughts.
Activity 10: Reflecting on your progress
Do you remember at the beginning of this module you were asked to take a moment to think about these learning outcomes and how confident you felt about your knowledge and skills in these areas?
Now that you have completed this module, take some time to reflect on your progress and use the interactive tool to rate your confidence in these areas using the following scale:
- 5 Very confident
- 4 Confident
- 3 Neither confident nor not confident
- 2 Not very confident
- 1 Not at all confident
Try to use the full range of ratings shown above to rate yourself:
When you have reflected on your answers and your progress on this module, go to your reflective blog and note down your thoughts.
7 Your experience of this module
Now that you have completed this module, take a few moments to reflect on your experience of working through it. Please complete a survey to tell us about your reflections. Your responses will allow us to gauge how useful you have found this module and how effectively you have engaged with the content. We will also use your feedback on this pathway to better inform the design of future online experiences for our learners.
Many thanks for your help.
References
Acknowledgements
This free course was collaboratively written by Maria Garza and was reviewed by Lucy Brunton, Claire Gordon, Natalie Moyen, Peter Taylor and Hilary MacQueen.
Except for third party materials and otherwise stated (see terms and conditions), this content is made available under a Creative Commons Attribution-NonCommercial-ShareAlike 4.0 Licence.
The material acknowledged below is Proprietary and used under licence (not subject to Creative Commons Licence). Grateful acknowledgement is made to the following sources for permission to reproduce material in this free course:
Module image: © Peter Hermes Furian/123RF
Figures 1, 2, 3 and 4: Garza, M.
Figure 5: Swedres-Svarm 2019. Sales of antibiotics and occurrence of resistance in Sweden. Solna/Uppsala ISSN1650-6332
Figures 6, 7 and 8: DANMAP (2019) Use of antimicrobial agents and occurrence of antimicrobial resistance in bacteria from food animals, food and humans in Denmark. ISSN 1600-2032.
An FAO report: FAO and Denmark Ministry of Environment and Food – Danish Veterinary and Food Administration. 2019. Tackling antimicrobial use and resistance in pig production: lessons learned from Denmark. Rome. 52 pp. Licence: CC BY-NC-SA 3.0 IGO.
Figures 10, 11 and 12: © The Open University
Figure 13: Surveillance design framework, https://survtools.org/wiki/surveillance-design-framework/doku.php, This file is licensed under the Creative Commons Attribution-Noncommercial-ShareAlike Licence http://creativecommons.org/licenses/by-nc-sa/4.0/
An FAO report on monitoring and surveillance of AMR: FAO. 2019. Monitoring and surveillance of antimicrobial resistance in bacteria from healthy food animals intended for consumption. Regional Antimicrobial Resistance Monitoring and Surveillance Guidelines – Volume 1. Bangkok. This file is licensed under a Creative Commons Attribution-NonCommercial-ShareAlike 3.0 IGO license (CC BY-NC-SA 3.0 IGO), https://creativecommons.org/licenses/ by-nc-sa/3.0/igo
A 12-point checklist for surveillance of diseases of aquatic organisms: a novel approach to assist multidisciplinary teams in developing countries: © 2021 Bondad-Reantaso, M. G. et al., Reviews in Aquaculture published by John Wiley & Sons Australia, Ltd. 1This is an open access article under the terms of the Creative Commons Attribution License, which permits use,distribution and reproduction in any medium, provided the original work is properly cited.
A case study: Drewe, J.A., Floyd, T. and Stärk, K.D.C. (2017) SERVAL: A generic framework for the evaluation of animal health surveillance, Version 1.3., 26 January 2017, available online at https://www.rvc.ac.uk/research/research-centres-and-facilities/veterinary-epidemiology-economics-and-public-health/projects/serval
Every effort has been made to contact copyright owners. If any have been inadvertently overlooked, the publishers will be pleased to make the necessary arrangements at the first opportunity.