Use 'Print preview' to check the number of pages and printer settings.
Print functionality varies between browsers.
Printable page generated Tuesday, 7 July 2026, 10:48 PM
Unit 4 Migration evidence
Introduction

In this Unit you will learn more about how to apply migration evidence. We will look again at the concepts of data, information and knowledge, and how these can be applied to facilitate knowledge exchange around the topic of migration. You were introduced to migration data in Unit 2 and you’ll look at the sources in more detail in this Unit.
4.1 Migration data, information and knowledge
As Unit 2 discussed, evidence can come from many different sources. Here we look at those sources in a little more detail. We also pick up on how migration evidence can map onto the Evidence Pyramid of data, information or knowledge:
Data : raw migration data without meaning, e.g. migration numbers, quotes from migrants.Information: migrant data with attached meaning for ‘who, what, where, when’ as regards migration issues.Knowledge : insight on ‘why and how’ migrant information can be used and applied to change issues, e.g. theories and models of migration.
An example of migration data
Table 4.1: Chinese workers in Kenya and Africa, 2013–2018
| Africa (data) | Kenya (data) | |
|---|---|---|
| 2013 | 214,534 | 2690 |
| 2014 | 259,370 | 4938 |
| 2015 | 263,659 | 7436 |
| 2016 | 263,659 | 8159 |
| 2017 | 263,659 | 8703 |
| 2018 | 263,659 | 9131 |
Migration information is migrant data that has been summarised, aggregated or processed, and is therefore easy to share. Migration data is considered ‘information’ when context is provided: which group(s) the data represents, how was the data collected, why, and when and where it was collected. Turning information into knowledge is complex, and it requires a deeper understanding of the context, rather than simple meaning.
Turning data into information
Let’s look at an example using the data from Table 4.1: Chinese workers in Kenya and Africa:
In the table you might notice a surge in 2014. We can add simple meaning to these figures with the added information that Kenya formed a new government, whose agenda was infrastructural development and who created the Public Private Partnership Act in 2013. Chinese companies were contracted to lead various infrastructure development projects.
In 2016 you might have noticed a decrease in the total number of Chinese workers in Africa. This is attributed partly to the civil unrest in Sudan. Prior to that, Sudan was one of the major destinations of Chinese workers in Africa, largely due China’s funding of major infrastructural projects in Kenya and the consequent trade agreements by both governments.
Migration knowledge is often practically and theoretically developed from data and information. It focuses on:
- Origin: where do migrants come from?
- Destination: which countries would you find migrants of a particular origin?
- Distribution: where are the largest flows?
- Demography: what is the age and sex, education and income of migrants?
- Impact: demographic, economic and social impacts on sending and receiving countries
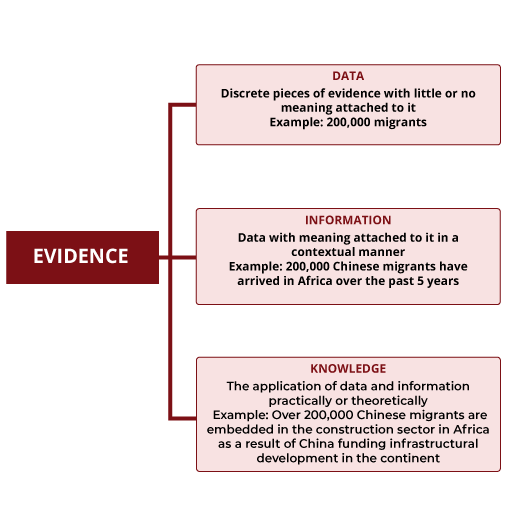
The evidence typology gives a visual representation of this continuum and the increasing amount of evidence at these different levels. In the evidence typology shown in Figure 4.1, the data represents a sample point that shows there are 200,000 migrants. We can find various types of data such as arrivals by country of origin, stock of migrants, stock of migrants by sex etc. Data is often presented in tabular forms with headings or as answers on questionnaires.
This data still needs to be interpreted in the context of the questions we ask. Are we interested in arrivals in Africa by country of origin? Or more specifically in Chinese migrants? Information helps us to contextualise this data in relation to our subject of study.
A more detailed form of evidence is knowledge. We may combine or process data and information to generate knowledge. If we find that there is an association between funding infrastructural development and Chinese migrants, and this specific to the construction sector, then we can call this knowledge. We may find such information by asking key informants such as government officials about infrastructural development funding and how this relates to Chinese migration in Africa.
 Activity 4.1 Migration data, information and knowledge
When you pass through an airport you often fill in a yellow ‘landing card’. In terms of migration evidence do you think this is data or information? Where do you think this evidence goes?
The Nigeria Immigration Service periodically releases data on arrivals and departures, but as researchers we need more information, such as whether foreigners who have come into Nigeria are there for tourism, to visit family, to work, or for other reasons. Spend a few minutes thinking of some examples that differentiate between data and information in your own work.
Discussion
Given that we work in diverse migration contexts, there will be many possible responses to this prompt. In my own context as a migration researcher in Nigeria, evidence presented on Africa, shows that about 60% of migrants remain within the region. This strikes me as conflicting with what I know about migrants from Nigeria, since only 30% of them remain within the region as inferred from the World Bank bilateral migration estimates. It matters for me to note that the African figures were average values and did not reflect the reality for outliers such as migrants from Morocco, Nigeria, or South Africa in 2018, whose migrants tended to go outside the continent.
Just as evidence comes in many forms, it also comes from many sources. No single source by itself can give a complete picture so you may need to combine sources. Next, you will discover some of the main sources
4.2 Sources of migration data, information and knowledge
Evidence on different migration phenomena are derived from different sources. This often requires considerable resources, infrastructure and IT/knowledge as you will learn in the next activity:
Activity 4.2 Strengths and weaknesses of migration evidence sources
Imagine you’ve overheard a colleague say the following:

With the evidence pyramid in mind, and using Table 4.2 to help you, consider the following questions to assess whether this ‘knowledge’ is correct:
- What type of data would need to be collected and where would you source it from to determine whether this statement is correct?
- Who would use this information and for what purposes?
| Type of Data | Definition | Source | Collected by | Migration Evidence collected | Used by |
|---|---|---|---|---|---|
| Statistical | Numerical and mostly describe quantities | Censures Household surveys Labour force surveys Arrival and departure reports Financial reports Tools: Questionnaires (online and offline) | Government officials Academics International Agencies (eg IOM, UNHCR, ILO, OECD, World Bank) | Number of immigrants in country Socio-economic characteristics Emigration figures Drivers of Migration Impact of migration (especially remittances) | Policy Makers Academics |
| Administrative | Provides records on administrative output | Administrative Records on Entry Visas Residence permits Work permits Tools: Data collection software systems | Government Officers | Migration Flows Reasons for migration | Government Officials Policy Makers Academics |
| Qualitative | Non numerical and describes qualities and characteristics | Case Studies Ethnographic Studies Narrative Research Tools: Interviews, focus group discussions and observations | Academics Policy Makers | Lived experiences of migrants Individuals Perceptions on various migration dynamics | Academics Policy Makers Entrepreneurs |
| Innovative | Emerging sources of migration data | Big Data IOM displacement tracking systems Tools: Digital technologies | Policy Makers Academics Entrepreneurs | Migration flows Economic and social Impacts of migration | Policy Makers Academics Entrepreneurs |
All migration stakeholders can make use of open data sources from:
- World Bank
- Organisation for Economic Co-operation and Development (OECD)
- UN Global Migration Database (UNDESA)
- European Union Open Data Portal
- National Bureaus of Statistics
- Central Banks
4.3 Strengths and weaknesses of the different sources of migration evidence
Migration evidence is migration data that is relevant and provides conclusive proof for a phenomenon or claim (Zinz, 2007). It is sometimes impossible to provide evidence on a migration phenomenon/claim because of insufficient migration data.
Click on the image below to reveal this scenario:
Collecting more numerical migration data may not always give a true picture of how people, organisations or countries are motivated, hence the need for a variety of migration data sources.
Next, you will look at the strengths and weaknesses of the different sources of migration evidence. Table 4.2 covered types of data, but below are some visuals of common examples of evidence, and in what circumstances they can be useful. You may want to use
Reflection
Can you think of a similar example showing how you can use
The Nigerian Immigration Services collects real time data on the number of passports issued in Nigeria. In fact, the Comptroller General of Immigration Services can see changes in numbers of passports issued and where they are issued from in real time. According to the advantages of this data type you can infer that whoever is watching the data can observe any significant changes in the way the data behaves, for example they can see if a state within the federation shows significant changes in numbers of passports issued on a particular day. However, the type of information collected will have to be limited since there is no consent from the participants to store details such as their gender or ethnicity.
Next read through the flip cards below and answer the questions relating to them in Activity 4.2.
Activity 4.3 Strengths and weaknesses of migration evidence sources
- Answer all the questions, using examples from your own experience:
- a.qualitative data
- b.administrative data
- Think of an instance where administrative and qualitative data were useful.
- Can you think of some other pros and cons of
administrative evidence in the migration context?
Discussion
Here is an example of the kind of answer you might have given:
One problem arising from qualitative data is that you may find the information cannot be generalised to a larger population. This can be a challenge, especially when there are vast differences in the experiences of the respondents. For example:
‘Once when we interviewed asylum seekers and refugees, we found some information consistent across the group interviewed, for instance the types of risks encountered on their journey. However, other information was specific to some kind of asylum seekers, for instance one person fleeing political conflict gave examples of how he thought that the host government was collaborating with his origin country embassy to have him returned. This was not verifiable.’
- a. There are a number of instances were agencies collect administrative data. For example, Migrant Resource Centres collect administrative data on the number of participants in their training programme and this is disaggregated by sex. Attempts to collect this data digitally in order to cover a wider range of respondents sometimes yielded conflicting results. For instance, in some cases respondents said that they had never heard of Migrant Resource Centres but went ahead to affirm that they had registered for a training program there.
- b. All data types can be useful depending on the purpose for which they are collected. Let us look at administrative data, Frequently, you may want to evaluate the reach or impact of your programme. For example, how many people have you trained in the last month? Or how many of these were male? Administrative data can help you check for a trend, such as if you have increased numbers of persons trained in your programme.
- How about qualitative data? In our work on migration qualitative data is very useful to providing in-depth explanations. We may be looking at how return migrants impact upon the country of origin. In Africa, respondents may tell us that return migrants bring ideas about new and productive business cultures from countries they have lived in.
- Another benefit of collecting administrative data about routine operations is the cost advantage. Already collected data needs no additional costs especially if we want to use the data to tell us some information about our respondents. For example, the immigration services usually collects information cards at points of entry which provide details about how many foreigners are arriving in the country. In addition to having the information handy when needed, it is difficult to infer this information from surveys after the fact has occurred since foreigners will be dispersed to various parts of the country once they enter.
A disadvantage I can think of is restricted study populations. In the example we gave, the immigration services collected information on arrivals of foreigners at airports. Yet there are many other entry points through which foreigners may come into a country; they may arrive by sea or by land for example. If the information is collected only about those who arrive by air, then we will have a limited population sample that leaves out arrivals through other points of entry.
4.4 Data and information ownership, responsibility, and control
Most immigration records are not openly available to researchers, who might be able to develop them into information and knowledge. Lack of data sharing becomes a major issue in developing good quality information and knowledge that will enable effective migration solutions. Below are some of the features of data and information according to ownership, responsibility and control. The list will guide you in examining how to use available data and information more productively and where access to data can be improved.
- Data and information availability continue to be a challenge for migration research and policymaking.
- Many migration data sources exist already, but the information is often fragmented or not easily accessible.
- There are various open data sources that can be freely used, reused and distributed by anyone, and can be accessed on equal terms by the international research community at the lowest possible cost.
- The majority of data on migration is privately owned, especially when it comes to the government and therefore difficult to access.
- Various stakeholders are encouraged to share data/information among themselves where it does not violate privacy concerns to share this publicly.
- There are regulations with regards to the extent to which government data and information on migration can be accessed and disseminated by other migration stakeholders.
- To encourage others to share their data with you, and continue doing so, you should:
- a.acknowledge them as the source of your data and information
- b.share your reports with those whose data and information you have used.
Activity 4.4 Information ownership, responsibility and control
Read this short case study about evidence and policy making around migration in Nigeria. It raises issues about who has knowledge, who needs knowledge (and in what form) and how can they best get the different stakeholders together to reflect on this and hopefully improve things. Once you’ve read it answer the three questions.
Felicity, alongside colleagues from her university, is investigating the activities of immigrants in Nigeria. The Nigeria Immigration Service (NIS) has shared some raw data on foreign arrivals and departures, in and out of Nigeria. Felicity must make a case to the Federal Ministry of Budget and National Planning on collecting more details from the NIS. The NIS itself needs more capacity to collect details and the Ministry of Budget and National Planning is reluctant to provide funds. Felicity need this information on immigrants categorised by activity to facilitate better planning on immigration in the future. Her colleague Isabelle decides to use an Evidence Café to enable all parties understand the use of this migration data. As a result, the Ministry of Budget and National Planning becomes convinced that it needs additional information even more than other agencies.
- a.What type of data/information do you possess as a migration stakeholder?
- b.How can an Evidence Café can be used by your institution?
- c.Which other stakeholders do you think might find the data/information you possess helpful?
Discussion
The types of data you possess are likely to be varied and you may not have even thought of them as data. In any organisation (or network of organisations) there will be different opinions and interests, so Evidence Cafés could be used in a range of scenarios and for a variety of purposes – it all depends what problem you need to address. In the fictional Nigerian case study you looked at in Activity 4.4, the problem was how to get more resources so that they could collect better data to inform more effective policy. You will undoubtedly have lots of different problems in your own work contexts which could benefit from better communication and collaboration.
Summary
In this Unit we presented the significance of
Unit learning outcomes:
- This Unit has introduced the different evidence types that can be used to support knowledge exchange around migration issues.
- It evaluated the strengths and weakness of different types of evidence and data.
- It introduced some of the issues around data ownership and control.
Next move onto Unit 5 Reviewing discussion objects, where you’ll learn about discussion objects in more detail.