Use 'Print preview' to check the number of pages and printer settings.
Print functionality varies between browsers.
Printable page generated Tuesday, 7 July 2026, 10:48 PM
Week 1: What is inclusive growth and why does it matter?
Introduction
Welcome to Week 1 of the course. Over the past decade, ‘inclusive growth’ is a term that has fast become a buzzword among economists and development communities. Large multilateral agencies like the World Bank and UN have been producing a multiude of briefings and reports calling for economies and growth globally to be more inclusive.
If growth needs to be more inclusionary, then there is an inherent assumption that something has been wrong with the growth trends up until now – that they have been exclusionary in some way. In the opening week, you will look at some of the key arguments and debates around the rise of this popular concept by asking: what is inclusive growth and why does it matter? In addressing this question, we focus mainly on two of the course’s learning outcomes:
- Understand the main debates and dimensions of inclusive growth.
- Appreciate and apply some of the methodologies for trying to measure inclusive growth.
1.1 A brief history of inclusive growth
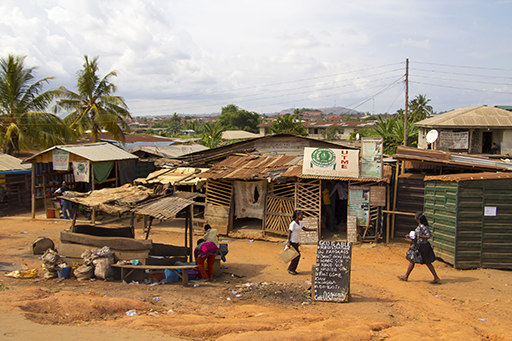
When you think of growth and economic development, Africa may not jump to the forefront of your mind. It is a continent often portrayed and associated with:
- underdeveloped infrastructures
- overdependence on natural resource revenues
- lacking market diversity
- chronic poverty
- being prone to political volatility and inefficient governance regimes
- high levels of aid dependency.
As of December 2020, 33 of the 46 countries classified as ‘least developed countries’ (LDCs) can be found in Africa. According to the UN, LDCs are deemed to have the lowest socioeconomic development in the world based on the Human Development Index rating (UNDP, n.d.). This does not immediately conjure an image of an environment conducive for strong, stable and effective economic development.

However, since the early 2000s, African growth patterns in terms of overall GDP have been rapid and consistent. Many countries experienced stable rates of growth that saw Africa as one of the fastest-growing regions in the world, second only to Asia (ODI, 2018). Africa is a continent that is rich in natural resources and many economies are tied to these commodities.
This dependency and lack of diversity in markets can leave countries susceptible to price shocks and global downturns or recessions, such as the oil price crashes of 2015 and 2018. Despite these vulnerabilities, overall, the trend in Africa has not only been growth but has been consistently higher than the global average. Even after a real GDP contraction of 2.1% in 2020, which is an evident impact of COVID-19 felt all over the world, the African Development Bank predicts that growth will return to 3.4% by the end of 2021 (AfDB, 2020).
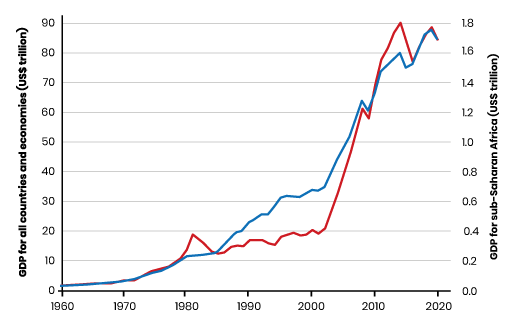
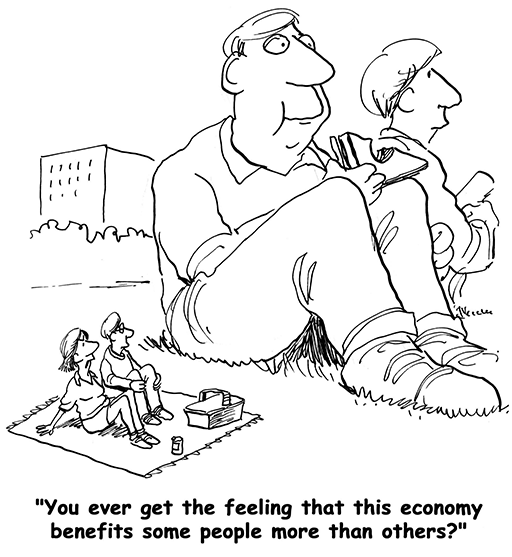
While on the surface these figures may appear encouraging, the story behind them and patterns to this growth are far more complex. Across regions and countries there is significant variance and experiences to this growth, and this is a pattern that extends to levels of growth happening within countries. A key determining factor in driving inequalities is how the dividends of growth are distributed: although Africa’s economies in general are on an upward trajectory, not everyone is benefitting or getting a share. In fact, the divide between the richest and poorest in Africa is not reducing; it is widening. In 2020, the World Inequality Database reported that the top 10% of earners were capturing 50% of national income (WID, 2020). This story is not particular to Africa but is part of a broader global phenomenon. Currently, the world’s richest 1% have twice as much wealth as 6.9 billion people (given a world population of 7.9 billion) (Oxfam, 2021).
The idea of inclusive growth (IG) has emerged over the past ten years as a way of framing this problem of deepening inequality. It is a response to the increasing recognition that, while absolute poverty levels have dropped significantly, the benefits remain concentrated in the hands of a few elites (Alexander, 2015). IG has become a driving tenet among development policymakers and multilateral agencies such as the World Bank, International Monetary Fund, United Nations and the African Development Bank. At its core is the argument that conventional conceptions of growth have failed to account for the inequalities gap because they equate growth solely in terms of economic outcomes. What is needed is a broader understanding of growth: something that incorporates social and political determinants, and is more participatory and inclusive of wider society.
1.2 What is inclusive growth?
The notion of IG has become a framing concept in development policy over the last ten years and a powerful idea driving global growth agendas. Its prominence and the attention it commands is because it is, first and foremost, a product of international multilateral agencies (Felipe, 2012).
The term first appeared in the early 2000s, when there was growing recognition and criticism that the received wisdom for growth may be problematic and flawed. Organisations like the World Bank noticed that their policy prescriptions for developing countries would translate into growth in terms of overall real GDP increases, but were not leading to reductions in inequality or positive transformations in the living conditions or standards of many in those countries – particularly the poorest and marginalised sections of society.
For decades, economic development had been guided by an ideology and principles that were formalised in the late 1980s in the Washington Consensus (Williamson, 2008). The Consensus was a set of ten market-oriented policy recommendations that, in combination, were to be a cure and provide the path to recovery for countries in financial crisis.
Recommendations included measures such as:
- privatising state enterprises
- trade liberalisation
- redirecting public spending from subsidies
- deregulating markets.
One of the most notorious uses of the Consensus measures were as part of Structural Adjustment Programmes (SAPs) of the 1990s. These were loans given by the International Monetary Fund (IMF) to countries, most notably in Latin America, that were on the verge of financial collapse. The loans were conditional, and these conditions consisted mainly of implementing the Washington-style market policies. The relevance for IG is that these policies were driven by the belief that development and human progress came through economic growth.
The limits of this model were beginning to show by the early to mid-2000s, and calls for a new approach began to emerge. The reasons and theoretical arguments for why IG is needed are covered in more detail in the following section, but at its core, and at its simplest, IG is about the failure of economic dividends to reach and benefit the majority of people who are engaged in the economies that are driving this growth. At its heart, it is growth that benefits everyone: economic success combined with a more equitable society.
The need for a new model for growth, away from purely economic outputs towards a more socially oriented and inclusive form, has been the basis for the rise of the IG agenda. This has been adopted and quickly become the mantra of major multilateral financial and development actors, and many see IG as a political imperative for governments to pursue. Yet, despite widespread agreement that IG may be the answer to the rising inequalities gap, once you begin looking at what it is, the picture becomes problematic.
Defining inclusive growth
There is widespread agreement that IG offers the best conceptual route to devising an understanding of growth that is beyond economics and promotes poverty and inequality reduction. However, this is where the consensus stops.
Activity 1.1: Comparing understandings of IG
Read the two extracts below and then watch Video 1.1. They are taken from three different multilateral agencies and describe how each defines IG. As you read and watch, make notes of the similarities and differences.
A development strategy anchored in inclusive growth will have two mutually reinforcing strategic focuses. First, high, sustainable growth will create and expand economic opportunities. Second, broader access to these opportunities will ensure that members of society can participate in and benefit from growth.
Without proper attention and planning, it will become increasingly difficult for growth to reach the impoverished who remain excluded by circumstance, poor governance, and other market-resistant obstacles. The region must promote greater access to opportunities by expanding human capacities, especially for the disadvantaged, through investments in education, health, and basic social protections. It must also improve the poor’s access to markets and basic productive assets by putting in place sound policies and institutions.
Finally, social safety nets must be strengthened to prevent extreme deprivation. ADB’s support for achieving inclusive growth in DMCs will include investment in infrastructure to achieve high sustainable economic progress, connect the poor to markets, and increase their access to basic productive assets. ADB will support investment in education and essential public services, such as water and sanitation, which particularly benefit the poor and women. These investments will provide the opportunity for all to improve their standards of living, thereby contributing to economic growth, poverty reduction, and the mitigation of extreme inequalities.
The majority of the poor in the region, including most of the absolute poor, are women. Women comprise the largest group among those excluded from the benefits of the region’s economic expansion. ADB will continue to emphasize gender equality and the empowerment of women as fundamental elements in achieving inclusive growth. It will also work to increase investments aimed at providing women with better access to education and other economic resources, such as credit.
Inclusive growth deals with the idea that economic growth is important but not sufficient to generate sustained improvements in welfare, unless the dividends of growth are shared fairly among individuals and social groups. At the same time, there is increasing recognition that, in addition to income and wealth, people’s well-being is shaped by non-income dimensions, such as their health and education status.
The level and distribution along these non-income dimensions are therefore key aspects of inclusive growth, making it a multidimensional concept. Moreover, to be relevant inclusive growth needs to be policy actionable, allowing policy makers to better understand the trade-offs and complementarities that exist across policy areas and the tools that can be used to achieve improvements in both the level and distribution of income and non-income outcomes. This is why it is important to consider the various dimensions of inclusive growth simultaneously and not one by one.
Inclusive growth builds on different strands of OECD work. In particular:
- The multidimensionality that is at the heart of inclusive growth has been a defining feature of the OECD’s work on well-being (OECD, 2011b), which identifies health and education outcomes, social connections, personal security, work-life balance, environmental quality of life and subjective well-being as important non-income aspects of well-being (see also Stiglitz, Sen and Fitoussi, 2009).
- The emphasis placed in inclusive growth on distribution builds on OECD work on the analysis of trends and drivers of income inequality in OECD member and selected partner countries, not least in Divided We Stand and related work, as well as on the evolution of non-income outcomes across individuals and social groups in OECD work on well-being.
- The policy orientation of inclusive growth builds on OECD work such as Going for Growth that analyses the policy levers for raising GDP per capita, and various strands of OECD work on labour markets, health and education policies, innovation and entrepreneurship, and regulation, among others.
The OECD project on inclusive growth develops a measure of ‘multidimensional living standards’ that accounts for selected non-income dimensions of well-being and their distributional aspects.
Transcript: Video 1.1 Expert answers: why is inclusion important for sustainable growth? Conversation with Pinelopi Goldberg, Chief Economist of the World Bank Group.
[Music playing]
[Music playing]
[Music playing]
[Music playing]
| Similarities | Differences |
Discussion
Some examples of similarities and differences are shown in the table below:
| Similarities | Differences |
ADB, OECD and World Bank
ADB and OECD
ADB and World Bank
|
ADB
OECD
World Bank
|
These were the key similarities and differences we see but you may have noted others. What is striking is in just these three short pieces there are significant differences in how these agencies understand and define IG.
The Asian Development Bank places emphasis on poverty reduction and social welfare that is not mentioned at all by Pinelopi Goldberg of the World Bank. In fact, she makes a point of saying it is not a discussion about making everyone equal and redistributing wealth. What is needed are greater incentives for people to access and participate in market activity.
The similarities and differences are not always clear-cut. The OECD stresses the need to acknowledge the complex nature of economies, which will require balances and trade-offs across sectors. Although not the same language, Pinelopi Goldberg is making a similar point when she says IG is not a one-size-fits-all solution, but will be context and challenge specific in an economy and its different dimensions. The only clear point of convergence appears to be that IG requires expanding opportunities and greater access to them.
This insight into how a few of the different key multilateral actors see IG is symptomatic of a wider issue. There are as many definitions as there are organisations advocating for IG, and an OECD report in 2012 highlighted that many understandings of the topic are vague.
It must be recognised that some of this is to be expected. Ideas that reorient conventional thinking around complex problems cannot be expected to be fully conceived overnight; they change and evolve as understandings develop. This is already happening as, over the past few years, IG has morphed in some circles to overlap with ‘inclusive development’. With the pressure of climate change increasing, there are calls for ‘green inclusive growth’, while others are talking about ‘digitally inclusive growth’.
One of the main points of contention that muddies the waters around how IG is defined relates to the issue of non-income outcomes. Both the Asian Development Bank and OECD extracts placed prominence on this dimension and talked in terms of improved health, education and social security. While the economic aspects and outputs from growth are well defined and understood, the IG literature becomes less clear when thinking about less tangible aspects of growth and development.
Activity 1.2: What do non-income outcomes mean to you?
Spend a few minutes noting down what non-income-related growth means to you. Then, as you have now looked at how several organisations frame IG, write your own definition. We will revisit this at the end of the week.
| Non-income related growth | |
| Inclusive growth |
Developing the MIAG framework
One of the first things that the MIAG team did was a comprehensive review of existing conceptualisations and frameworks, including the two you looked at in the last activity.
Because so much work already existed and was being used extensively in policy circles, we wanted to see if any of it might already align with the aims of the project. A key gap in the IG literature is a lack of academic attention, so rather than reinvent the wheel, MIAG wanted to build on what might already be being used in policy and practice.
Two of the observations that the MIAG team got from the review that became central to the project’s framework were as follows:
- The need to sensitise our conceptualisation of inclusive growth to migration: The review showed that virtually all existing framings did not account for population mobility and migration as a factor for growth. One possible reason is that most IG frameworks take the nation as the main unit of analysis and there is a tendency for national growth policies to be divorced from immigration policy. Hence, migration becomes an overlooked variable in IG debates.
- Trying to unpack a more comprehensive picture of what ‘non-income’ means: The review highlighted a clear trend towards frameworks focusing on indicators that were more skewed toward still measuring growth in conventional terms – as income and financial growth. Much of the existing literature was still struggling to get to grips with developing a comprehensive set of indicators that would be able to start making connections between inclusion and growth, and measuring it in broader political or social terms.
Figure 1.3 is the finalised conceptual and analytical framework developed by MIAG. The characteristics and determinants component will be explained in more detail in Week 2, when you look at the migration and development debates, but in short, each of the four teams developed an extensive country report detailing the history and profile of migrants, and how they connect to the economy and growth. These reports were a foundation upon which the study could build the empirical case for investigating particular migrant groups and sectors. With regard to the framework then filtering down to our indicators for IG outcomes, MIAG took the standardised approach of separating income from non-income. The former are pretty straightforward and need little explanation, but the rationale for the less tangible measures were based on considering how wider social and political development and growth may be happening but needing to be able to find ways to make causal links to migration.
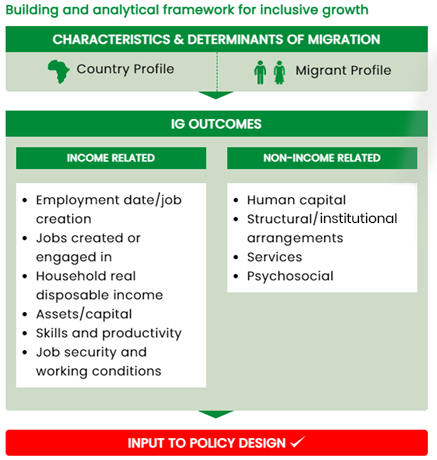
Having considered how IG is understood, the next section will look behind the definitions at some of the key debates informing them. To do this, each of these four broader categorisations of ‘non-income-related’ growth were broken down into two or three classifications that can connect to migrant business activity (Table 1.1).
Human capital (how migrant businesses are contributing to development of in-country capacity):
| Structural (how migrant businesses are contributing to wider transformation of institutions and society):
|
Psycho-social (how migrant businesses are contributing to individual, groups and societies comfort and happiness):
| Services (how migrant businesses are contributing to wider social welfare):
|
Each of the bullet points in Table 1.1 are themselves broad categories, but they allowed MIAG to introduce a layer of granularity to the non-income dimensions of IG that had largely been missing. As you will see in later weeks of the course, we unpacked each of these further into a more expansive set of growth indicators that the team used as the basis for interrogating the data across all of the collection methods, from the secondary data to the survey and semi-structured interviews, allowing the team to build up a more complex picture of the links between migration and IG.
1.3 Why does growth need to be more inclusive?
‘The widening gap between rich and poor is not just natural phenomena. It is a sign that much of what we have been doing, especially in terms of models of economic growth, has been wrong’ – Winnie Byanyima
This quote by Winne Byanyima, Executive Director of UNAIDS (the Joint United Nations Programme on HIV/AIDS) and an Under-Secretary-General of the United Nations, summarises the impetus for moving to IG. This is to address the deficiencies of focusing only on economic growth, and recognition that the past 30 years have seen growing inequality. While growth has occurred, its benefits have not been spread evenly across societies.
If the reason why greater inclusivity is needed is clear, to reduce the divide, then the next logical question becomes: who should be included, and how? In this section, you will look at some of the key debates and arguments around what more inclusivity looks like; but first, you will look more at how inequalities are manifesting.
Watch Video 1.2, the World Economic Forum’s brief overview of the scale of the inequalities gap and some of its key features.
Transcript: Video 1.2 World Economic Forum: economic growth and social inclusion.
The global economy is at risk.
Unemployment, rising inequality, and low productivity remain some of our most pressing global issues.
Over the last 10 years, median household income has stagnated or declined in many advanced economies resulting in a more vulnerable middle class at risk of falling into poverty.
The average income of the richest 10% of the population is 9 times higher than that of the poorest 10%.
That’s 7 times higher than it was 25 years ago.
Over the next 20 years, technology is expected to improve productivity by 30% in some industries.
But it could also leave up to 50% of workers at risk of being displaced.
We need to rethink the way our economies work.
A people-centric approach is the only way to avoid growing disparity, social instability and poverty.
Public–private cooperation is key to addressing the Global Challenge of economic growth and social inclusion.
The OECD, the G20, and the United Nations are all working towards addressing these issues.
The World Economic Forum offers reliable tools to address productivity and inclusive growth challenges such as The Global Competitiveness Report and The Inclusive Growth and Development Report.
Join the conversation, to ensure that economic growth and social inclusion are at the top of the global agenda.
Learn more: www.weforum.org
Now watch Video 1.3 by the OECD. ‘The power of four billion’ highlights what benefits can be reaped when doors to participation in the economy open.
Transcript: Video 1.3 OECD: the power of four billion.
4.6 billion people in the world want a better life, and they want to play their part in making the world a better place, but too often they can’t – only because they are young, a woman or both.
Take youth. On average, 60% of young people in developing countries are unlikely to reach their career goals. And yet getting them into education or employment could make an economy like Viet Nam’s grow by an extra 2.5%.
And women. The laws, attitudes and practices discriminating against them represent a huge cost for the global economy. If women could play the same role as men in their communities and in labour markets they would add 28 trillion USD to the global economy by 2025.
Are we holding back the power of the 4.6 billion by overlooking the evidence? By sticking to outdated laws, stereotypes, social norms? The 2018 Global Forum on Development gathers businesses, youth organisations, associations and governments to work and act together to find solutions. Because unleashing the power of youth and women will empower us all.
While evidence may show that absolute poverty levels have been declining, what the information and data in these videos show is that many people’s connection to growth is precarious. What this means for their future progress and livelihoods is escalating unemployment levels coupled with reductions in productivity, household incomes declining and failing social welfare systems. The OECD video, however, looks at the problem through a lens of needing to unlock untapped potential, in which they make particular reference to women and youth.
The inequalities gap is not just about deepening division between countries but, as the OECD video references, it is just as much a problem within countries.
A burgeoning inequality gap – the case of Nigeria
Nigeria was one of the four fastest-growing economies in Africa that was the focus for MIAG. It has been popularly referred to as the ‘Giant of Africa’. This is because of its population size, at the time of writing just over 206 million, but also because of the size of its economy.
Since oil was first discovered in Bayelsa State in 1956, it has consistently been the largest producer of crude oil on the continent. Despite being resource-rich, with an annual income from oil exports estimated at $20–40 billion (OPEC, 2017), according to the World Poverty Clock, in 2018 Nigeria overtook India as the world’s poorest country, with 86.9 million people classified as living in ‘extreme poverty’ – nearly 50% of the total population (Kazeem, 2018). At the time of writing, India has regained the title but the margin between them is small.
With access to a wealth of resources, including oil, minerals and fertile land for agriculture, why would such a powerhouse of an economy be seeing these extreme levels of poverty and escalating inequalities?
Activity 1.3: Telling the story of Nigeria’s growing inequality globally and nationally
Figures 1.4–1.7 show yearly levels for four different indicators that the MIAG project used in its quantitative analysis to measure growth, drawing on data from the World Bank and International Labour Organisation.
Each figure shows the years 1990–2018, which is the 30-year timeframe that the project chose to cover.
Now you will look at some of the main debates around how inclusion can happen.
IG has been a feature of the financial global agenda for over a decade, but it has only recently been subjected to sustained academic attention (van Niekerk, 2020). One of the most contentious and confounding issues in debates centres around the nature of inclusivity.
The AfDB (2016) terms growth as inclusive if it is for ‘the benefit of widest social and economic groupings’. Ianchovichina and Lundstrom (2009), writing for the World Bank, deem inclusivity to be ‘inclusive of the large part of the country’s labour force’.
There is a vagary with which inclusiveness is referred to in statements like these that are common to the IG literature. They often lack any definitive attempt to delve into more detail of who should participate, when and how. Despite this, however, there are some shared threads in the inclusivity debates, and here you will look at four of the key ones:
- pro-poor versus broader-based development
- process rather than outcome
- gender
- multidimensionality and trade-offs.
Pro-poor versus broader-based development
Ranieri and Ramos (2013, p. 4) stress that there is little debate that IG emerged out of rethinking in the development literature calling for a reorientation of growth to benefit the poor: ‘growth is not inherently pro-poor; therefore, growth processes need to be calibrated for pro-poor growth to be obtained’. Their point reiterates there is agreement on the need for IG to be poverty-reducing. However, there is significant division between those who see IG as an exercise in benefiting and enabling the poorest and most marginalised/vulnerable sections only (that is, a pro-poor agenda), and those who see pro-poor poverty reduction as only one component within wider efforts to develop society more broadly.
For the latter, growth needs to be sustainable and broad-based across all sectors, and inclusive of the majority of the labour workforce (Ianchovichina and Lundstrom, 2009). Rather than just bringing the poorest into the growth equation to bridge the inequalities gap, growth is seen as a wider societal development goal so that all benefit, but with special attention and provision given to enable growth amongst the poorest (Sumner, 2017; Asian Development Bank, 2011).
Whichever side you stand on, the argument indicates a need to be clear about who the poor are, how they are being defined and whether those then deemed as living in poverty need to be considered separately from the rest of society in the process of IG.
Process versus outcome
Along with the realisation that conventional growth needed an overhaul came the awareness that existing models were outcome centric. The preoccupation with GDP, employment figures, inflation rates and productivity levels consider growth as more inclusive if the benefits are more evenly distributed.
Inclusion is therefore a by-product of growth without an explicit proviso of whether those who benefit are taking part in the growth-generation. Putting more emphasis on participation shifts thinking to a view of inclusion as a practice (Ranieri and Ramos, 2013), whereby broader sections of society once excluded become active agents of growth. IG then is more of a process, the quality of which is judged by those participating in growth.
Gender
Much of the IG literature speaks of the importance of gender-sensitising IG (ADB, 2008; Crush et al., 2017). The rationale rests on recognising that women are frequently the most vulnerable, marginalised and impoverished.
In many developing countries, their inclusion in the labour force is largely through informal sectors, so they are often overlooked. Video 1.3 estimated that if women can participate and play the same role as men in economies, they would add $28 trillion to the global economy in just five years.
The issue of women’s increased inclusion is also symptomatic of a wider need to target vulnerable and discriminated groups, such as marginalised ethnic or religious groups.
Mulidimensionality and trade-offs

The difficulty in pinning down a definitive understanding of IG may rest on the complexity of the problem – the list of factors and conditions are multifaceted. Whatever mix a conceptualisation includes, there are likely to be conflicts and trade-offs between different dimensions of the equation that will impact on the growth-equity relationship.
IG is not likely to be a straightforward, simplistic and linear process (Anand et al., 2013). The link between political space and growth is one example, such as with the Arab Spring Uprising, which was preceded by an exceptional period of economic growth. The violence and unrest that emerged was a direct response to the inequity of the benefits reaching the majority, although the political unrest halted this growth.
Instability in a country due to political change can, in the short-term, reduce growth. How these different aspects of growth interrelate could be an important point in a conceptualisation, but it also indicates the possible need for factoring in short-, medium- and long-term conditions (Hakimian, 2013). So there is broad recognition that careful consideration needs to be given to how different policy areas combine, synergise and create trade-offs to generate IG.
Activity 1.4: Reflecting on the four issues
Take a moment to think about the four issues that are at the forefront of shaping thinking around IG:
- Did you find yourself agreeing with one side or the other in a debate?
- Are you pro-poor, or do you think that growth needs to benefit everyone more broadly?
- Would you consider prioritising greater participation of women, even if it meant there was a trade-off that would disadvantage another group in a society?
Discussion
There are no right or wrong answers, because all are valid; debates about choosing process over outcome are not really polarising because they are not mutually exclusive. It may be possible to conceptualise IG in a way that values both. In theory, trying to simultaneously lift the poorest out of poverty would not be incompatible with trying to close the gap between the top and bottom.
From just these four factors, you can see how complex and multifaceted the problem is, which is why perhaps an all-encompassing, comprehensive and clear understanding of IG is so elusive. While it is natural that understandings of a normative ideal like IG can differ and evolve, it does create implications for how IG is studied empirically or analysed, and how this translates into actionable policy – as you will see in the next section.
1.4 Measuring inclusive growth
IG began in leading multilateral financial institutions, like the World Bank and the International Monetary Fund. As such, it has always been led by a practical agenda of how to develop policy interventions that will drive more participatory economies. Before one can consider how to devise these purposive actions, it is important to be able to analyse and measure the process of growth. Here, you will look at some examples of frameworks that have been developed for this aim.
In the first few years following the emergence of the IG agenda, there appeared to be little attempt to systematically or empirically bound IG. Ranieri and Ramos (2013) stated that ‘the few existing analyses mirror the conceptual debate’, lacking cohesion and clarity behind the framing. The landscape has since changed dramatically, and there are as many analytical frameworks as there are organisations working on the topic.
Activity 1.5: Comparing IG frameworks and indicators
Two of the most prominent frameworks have been developed by the OECD and the African Development Bank (Table 1.2). Look at both of them, and then note down any similarities and differences.
| OECD category/indicator | AfDB dimension/indicator |
|---|---|
|
|
| Similarities | Differences |
Discussion
The conceptualisation of the high-level component dimensions might be couched in very different language:
- AfDB uses broad categorisations such as ‘social’ and ‘environmental’.
- OECD uses ‘firms, people and places’.
The logics sitting behind them, once you delve into the disaggregated indicator sets, are not dissimilar. Although a plethora of these analytical tools exist, there are some surprisingly similar trends across them. For example:
- Analyses tend to take a national-level perspective in assessing how far a particular country has achieved some measure of IG.
- Within the nationally centred framework, there are few attempts to apply IG to particular economic sectors or social groups.
- Dependence on composite indicators and sets as the way to measure and track IG. What is interesting to note is that while the ‘pillared’ categorisation in the OECD framework is a favoured organising principle, there are few attempts to triangulate between indicators within the same, or across different, sets.
A reliance on macro-economic datasets that are often incomplete or unreliable. Few studies on IG use mixed methods and qualitative data. One issue of using secondary datasets is that it means any causality between different factors of growth can only be inferred. This is problematic when trying to unpack complex economies and, particularly, when it comes to non-income-related outcomes.
The indicator framework that MIAG created ended up containing 37 different indicators – too many too list here – and was developed with those wider trends in mind, as the team did an extensive review of existing models.
The OECD framework was chosen as as a good basis, structurally, to build around the same four categories. This is because Category 1 (growth and ensuring equitable sharing of benefits from growth) included a detailed set of composite economic growth factors, but Categories 2, 3 and 4 spoke much more broadly to the social and policitical dimensions of IG that MIAG wanted to thoroughly explore. The team removed one or two of the OECD’s indicators that were not relevant to the project’s focus on SMEs, but largely kept the set as it was.
The additional indicators incorporated measures that the team could use to assess the influence and impact of migration on growth. Indicators looking at remittance flows were introduced to Category 1, and levels of corruption and political stability were added to governance as factors that may affect attracting and operating migrant business, for instance.
One of the main disadvantages of secondary quantitative data in these IG frameworks is the limitation of being able to make causal connections across indicators, as mentioned above. To get around this, MIAG used two other data collection methods, surveying and semi-structured interviews, which you will learn more about in the coming weeks.
1.5 Moving the inclusive growth agenda forward
As you come to the final section of Week 1, you will be taking a brief recap of all the main arguments and issues that you have looked at so far, and will consider the following question: is IG the panacea for addressing the inequalities gap that many hold it to be?
Having learnt about some of the leading conceptual and analytical frameworks, you will revisit your definition of IG from Section 1.1.
The key features of IG are as follows:
- It is a response to a global problem of a deepening divide between the richest and poorest – the growing inequalities gap.
- Poverty-reduction is a core tenet, but there is no single definition of what constitutes poverty and how you measure it. There is also a difference around whether to focus exclusively on lifting the poorest out of poverty, or if poverty-reduction is part of wider growth across all levels of society.
- Current growth models are insufficient for addressing inequalities, which relies on more than economic outputs alone. IG is about more human-centred growth that includes non-income factors such as human capacity development, improving social and welfare services, and strengthening governance and infrastructure.
- Building from the previous point, IG is about a broader developmental agenda that seeks to improve the lives and opportunities of all members of society by fostering greater equality.
Throughout this week, you have seen the problems that come with both defining IG as a normative ideal, and empirically framing and measuring it. Not everyone is enamoured with the notion, however, as you will now see.
Activity 1.7: IG is not progressive
As you read the extract from the paper ‘We need an inclusive economy not inclusive growth’ (Burch and McInroy, 2018), note down their key reasons for why IG is not the solution many claim it to be. Then, ask yourself the following questions:
- Do you agree with all or any particular parts of their argument? Why?
- From what you have read about IG so far, are there any counter arguments to their case?
Discussion
Burch and McInroy argue that IG, as currently conceived, only provides the opportunities it promises once growth has happened; it does not hold up a critical enough lens to how that growth happens. Think back to the Washington Consensus and the liberal roots of IG: Burch and McInroy maintain that it does not go far enough to challenge and reform the foundation of what growth is and the types of policies it prescribes.
In terms of their three arguments, we agree with their first point – you learnt about the fuzziness that surrounds definitions of IG. Second, they maintain a greater need to consider environmental degradation. This is becoming more of a prominent feature as ideas of ‘sustainability’ and ‘green inclusive growth’ gain more traction in academic and policy circles. Finally, it is interesting to note that the issue of no (or negative) growth does not appear in the literature, and raises a very important point that there is perhaps an underlying assumption in thinking that growth is happening.
In terms of a counter-argument, you may have noted other points, but in our opinion Burch and McInroy are perhaps still concentrating on the outcome-centric part of the IG debates and over-looking its process-oriented nature. If process and outcomes can be reconciled in an IG model, this may go some way to overcoming the lack of agency for those historically left out of the growth that these arguments suggest is required.
Activity 1.8: Revisiting your definition of IG
Having expanded your understanding of IG, the key issues and debates, revisit the definition you wrote for Activity 1.1. How has it changed and why?
A perennial problem with IG has been the lack of a unified and comphrensive definition. The MIAG team was conscious of this gap from the outset, and the question of whether and how we boundary our understanding was a core question that was continually revisited over the lifetime of the project. Now that you have looked over some of the key debates and framings around IG, let’s round off the week by watching Video 1.4, in which project lead Professor Giles Mohan talks about what IG has come to mean in MIAG.
Transcript: Video 1.4 What IG is to MIAG.
Conclusion
This week you have:
- learnt about the limits of growth, the growing inequalities gap and why a new way of thinking beyond economics is needed
- looked at the understandings and debates around IG, highlighting the contested and complex nature of the concept
- reviewed some of the leading frameworks that have tried to operationalise the study of IG, and the challenges this presents
- considered key critiques of IG and developed your own understanding.
Having considered the complexity, different dimensions and peculiarities of IG, is there a case that Africa and African growth might need its own understanding and analysis? This is picked up in Week 2, looked at through a lens of migration.