Use 'Print preview' to check the number of pages and printer settings.
Print functionality varies between browsers.
Printable page generated Saturday, 13 June 2026, 6:27 PM
An introduction to AMR surveillance
Introduction
The aim of this course is to explore the concept of surveillance, its types and purpose in the context of
By the end of this course, you should be able to:
- understand the purpose of surveillance
- describe key surveillance terms and concepts
- describe different types of surveillance
- understand different methods of undertaking surveillance
- understand the purpose of AMR surveillance
- describe different types of AMR surveillance
- understand the importance of comparing surveillance across sectors (human, animal, agricultural and environmental).
Start this course by watching this video on surveillance.
It will take about eight minutes. For the purposes of this course, the focus will be on public health surveillance.
In order to achieve your digital badge and Statement of Participation for this course, you must:
- click on every page of the course
- pass the end-of-course quiz
- complete the course satisfaction survey.
The quiz allows up to three attempts at each question. A passing grade is 50% or more.
When you have successfully achieved the completion criteria listed above you will receive an email notification that your badge and Statement of Participation have been awarded. (Please note that it can take up to 24 hours for these to be issued.)
Activity 1: Assessing your skills and knowledge
Please take a moment to think about the learning outcomes accompanying this course and how confident you feel about your knowledge and skills in these areas. Don’t worry if you don’t feel very confident in some areas, as these might be the ones you are hoping to develop by studying this course.
Please use the following scale:
- 5 Very confident
- 4 Confident
- 3 Somewhat confident
- 2 Slightly confident
- 1 Not at all confident
1 What is surveillance?
Public health surveillance is defined as ‘ongoing, systematic collection, analysis, and interpretation of health-related data essential to planning, implementation, and evaluation of public health practice, closely integrated with the timely dissemination of these data to those responsible for prevention and control and relevant public health stakeholders to inform action’ (WHO, 2021).
‘Public health surveillance dates back to […] 3180 B.C. in Egypt. Hippocrates (460 B.C.-370 B.C.) coined the terms endemic and epidemic, John Graunt (1620-1674) introduced systematic data analysis, Samuel Pepys (1633-1703) started epidemic field investigation, William Farr (1807-1883) founded the modern concept of surveillance, John Snow (1813-1858) linked data to intervention, and Alexander Langmuir (1910-1993) gave the first comprehensive definition of surveillance.’
Activity 2: Reflecting on surveillance
1.1 What is the difference between surveillance and research?
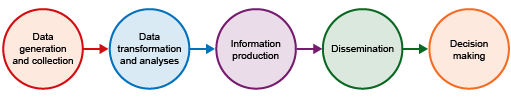
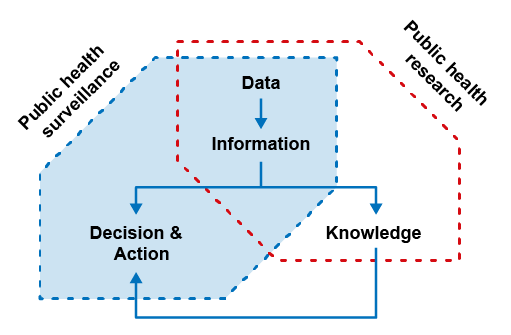
The continuous collection, analysis and interpretation of data to provide evidence for decision-making and action in public health (Figure 1) is an attribute of surveillance. This sets it apart from other undertakings involving data capture and analysis for research, for example. Research generally aims to widen knowledge on a particular topic, the need for which is often guided by surveillance (Figure 2). Another attribute which distinguishes surveillance from research is that surveillance makes practical use of what is easily available, often making it cheaper and easier to perform in the long term than a comprehensive prospective research study. This allows for long-term applications. Research, on the other hand, is a ‘best practice’ method that typically takes place over a short period of time and is often resource-intensive. During the course of surveillance, there may be some pragmatic considerations about how information is collected (for instance, making information easier and/or quicker to gather). Surveillance and research can overlap in some of the data being collected (see Figure 2), but the purpose of the two activities is different.
Activity 3: Reflecting on the differences between surveillance and research
Having read about the differences between surveillance and research and familiarised yourself with Figure 2, can you correctly identify the actions below as those carried out either by surveillance or research? Note that the distinction between research and surveillance is not always completely clear, so try to pick whether the activity most likely corresponds to research or surveillance.
- Detection of patterns in infection over time.
- Collection of information on the risk factors for a new form of infection.
- Making use of routinely generated hospital disease event data.
Answer
- Detection of patterns in infection over time – most likely surveillance as over periods of time.
- Collection of information on the risk factors for a new form of infection – most likely research as new form of infection.
- Making use of routinely generated hospital disease event data – most likely surveillance as routinely generated data.
1.2 Purpose of surveillance
Surveillance should be conducted for a specific purpose, central to which is the public health question that the collected surveillance data will be used to answer. Consequently, if a surveillance program is not created around a specific question, or questions, that it will answer, then it is a poorly constructed surveillance system. The surveillance methods and data sources must be matched to the specific goals of the surveillance.
Surveillance systems are set up to perform one or more of the following:
- Provide information that can be used for health action by public health personnel, government leaders and the public.
- Underpin public health policy, set priorities and guide interventions to tackle issues of public health concern.
- Serve as an early warning system and a central pillar of public health emergency preparedness.
- Understand disease dynamics, patterns, seasonality, risk factors (aid understanding of disease epidemiology).
- Assess the impact and effectiveness of interventions and strategies to tackle public health issues.
- Develop hypotheses relating to risk factors of disease, which can be explored through analytical studies and research.
Surveillance forms the foundation for public health action to improve health outcomes. This function calls for surveillance to operate under a mandate of global, national or regional governmental organisations to secure the health of the public. High-quality evidence gathering is central to meeting this mandate and is made possible by good-quality surveillance. The information gathered from surveillance allows local and regional agencies, governments and global organisations to respond quickly and effectively to public health threats and concerns as they develop (Smith et al., 2013).
Surveillance infrastructure is central to good-quality surveillance. National governments, in liaison with global organisations (e.g. the World Health Organisation (WHO), Food and Agricultural Organisation of the United Nations (FOA), and the World Organisation for Animal Health (WOAH)), encourage the development of national action plans for different diseases. These national plans typically lay out the strategic framework for developing and maintaining national-level surveillance infrastructure. Governing bodies and public health practitioners (at national and local levels) use this ‘direction’ to inform the development of strategic frameworks to guide and prioritise surveillance systems, according to their local context and resources.
Designers and users of surveillance systems have to ensure that these systems are flexible and agile enough to be able to respond to ever-evolving public health demands and corresponding statutory requirements. Surveillance systems also need to be able to adapt to advances in information technology – these can allow for increasingly rapid and cheap data collection, analysis and dissemination to help direct and support health care policy.
Before concentrating on the types of surveillance systems out there, let us discuss the important terms we need to familiarise ourselves with when discussing surveillance.
1.3 Key surveillance terms
- Data – This term refers to a set of observations or measurements relating to a particular entity. An entity, in keeping with the ‘public health’ scope of this course, can be an individual, for example, a hospital patient or a bacterial isolate. Data can be processed or unprocessed and represented as text, numbers or multimedia. A more detailed discussion around this term is provided in the course Fundamentals of data for AMR.
- Dataset – A dataset is a structured collection of data, usually taking the form of a table with rows and columns. A more detailed discussion around this term is provided in the course Fundamentals of data for AMR.
- Database – A database is an organised collection of multiple datasets. Databases are generally hosted on a computer network, allowing for easy access and manipulation.
- Infection – Refers to a state of disease which occurs when a foreign pathogenic organism, for example, a bacterium, enters the body, multiplies and causes the host harm.
- Bacterial infection – When an infection is caused by bacteria.
- Carriage – A state when a person (or animal) harbours a specific
infectious agent without discernible symptoms of disease. The infectious agent lives on some specific surface of the body or somewhere inside the body (the niche). This ‘carriage state’ serves as a potential source of infection, either to the individual themselves or following transmission to another individual. Carriage may exist in an individual with an infection that is not apparent throughout its course, known as inapparent. This individual is commonly referred to as healthy orasymptomatic carrier. - Healthcare-associated infection – An infection acquired by a patient while in a hospital or healthcare facility, in whom it was not present or incubating at the time of admission to the facility. Healthcare-associated infections are also referred to as nosocomial infections.
- Community-associated infection – An infection occurring in an individual contracted outside of a hospital or healthcare facility. For a patient admitted to hospital, it is assumed that any infection occurring within 48 hours of admission has been acquired in the community.
- Healthcare facility – Generally refers to a location where healthcare is provided, for example, a hospital or clinic, or a veterinary clinic or hospital.
- Incidence – The number of new cases of a specified disease diagnosed or reported during a defined period of time. When this number of new cases is divided by the number of persons in a stated population in which the cases occurred, it gives you the incidence rate. This is usually expressed as cases per 1000 or 100,000 population.
- Prevalence – The total number of persons (or animals) sick or exhibiting symptoms of a certain condition in a stated population at a particular time (point prevalence), or during a stated period of time (period prevalence), regardless of when that illness or condition began. When this number is divided by the population at risk of having the disease or condition at the point in time (or midway through the period in which it occurred), it gives you the
prevalence rate .
1.4 Important concepts in surveillance
In addition to the above terms, public health surveillance includes a series of concepts. It is important to understand how these concepts are interpreted when talking about surveillance.
Capture and reporting frequency of event data
Surveillance captures data on an ‘ongoing’ basis. In doing so, surveillance doesn’t always intend to capture all such events of the disease of interest. Rather, surveillance attempts to consistently capture a similar proportion of events over time and to report these data in a regular way. The frequency of reporting of these data is linked to the public health question being asked. Rapid reporting of surveillance data is crucial in high-hazard situations, for example, when dealing with a highly infectious and rapidly spreading
Source of health information
The sources of health information that surveillance can use are varied. Surveillance systems can collect data directly from persons (or animals) in a population, from laboratory samples, clinical diagnosis of a disease based on symptomology made by clinicians in a hospital or veterinarians in a veterinary clinic, or from a population census – making use of data captured for a non-public health purpose. The type of data collected depends on the purpose of surveillance.
Link to prevention and control of infection
Carrying out public health surveillance is justified by the link between the gathering of information and the performance of interventions that prevent and/or control a health event, such as disease. Good surveillance activities are linked to effective response interventions. Surveillance data are also important in guiding research activities, which might guide new public health interventions in the future.
2 Types of surveillance, their characteristics, purpose, benefits and explanation of the kind of data collected
Public health surveillance encompasses a broad range of indicators and data sources and can broadly be grouped under the following categories:
- reportable disease surveillance
- population-level vital statistics surveillance
- disease registry surveillance.
We will review each of these in turn. Note that each of these categories is defined by their purpose and the kind of data they collect.
2.1 Reportable disease surveillance
Effective surveillance is essential in tracking the trends in
Example 1: In the sub-Saharan African state of Ghana, the National Surveillance Unit, created in 1998, coordinates a surveillance system which gathers and reports on
Weekly and monthly disease tally data are used to complete standardised reporting forms, which are submitted to the DHIMS2 system. If you wish, you can read more information about disease surveillance in Ghana (Gyaase and Bright, 2019). Reports on disease incidence and prevalence based on these data are used in Ghana to inform planning and decision-making nationally in an effort to prevent and control the spread of disease. Over the period DHIMS2 has been operational, it has provided valuable information on the prevalence of disease of national importance in Ghana. Some examples are confirming malaria to be the most prevalent disease country-wide, prompting authorities to roll out effective malaria control interventions, tracing an increase in the incidence of pneumonia in the paediatric population and confirming the impact of the national meningitis vaccination programme through observation of a reduction in reportable cases over time.
Example 2: In the UK, for animal health, there is a
In the event of a notifiable disease (for example, rabies), veterinarians in the UK are required to contact the
Activity 4: Reflecting on reportable disease surveillance
2.2 Population-level vital statistics surveillance
Vital statistics encompasses data on births, deaths, life expectancy and sometimes also information on chronic conditions. These data provide key insights into important population-level health trends in a country. It allows countries to monitor changes in population makeup, inform public health policies and/or track progress of public health interventions over the long term. Using this kind of data is a form of public health surveillance. Different countries achieve this data collection in different ways.
Example: The
2.3 Disease registry surveillance
Registry surveillance is central to monitoring on some forms of non-communicable diseases in many countries. Disease registries have been used since the 1800s and are most commonly used for cancers. In the field of healthcare, a registry is defined as ‘a file of data concerning all cases of a particular disease or other health-relevant condition in a defined population such that the cases can be related to a population base’ (Last, 2001). A substantial amount of work is needed to maintain a complete disease registry of all known cases, so registries are typically only used for relatively rare and clearly defined diseases. When data in a registry is later used for public health purposes, this can be termed registry surveillance. Registry data can be used to inform on the incidence and prevalence of a specific disease or health condition, such as specific forms of cancer or to assess the effectiveness of interventions, including treatments, to reduce disease prevalence.
Example: The
The examples above are not exhaustive, but they illustrate the wide variety of surveillance systems that are used to collect health information from human and animal populations around the world.
3 Surveillance methods
Most public health surveillance employs one of the following methods to collect data. In this section, we discuss the most common approaches: passive, active, syndromic and sentinel surveillance. In practice, these methods are not mutually exclusive, so a surveillance program may use approaches from one or more of these methods. We also briefly describe methods typically used for AMR surveillance.
3.1 Passive surveillance
As the term suggests, passive surveillance is defined by the absence of an ‘active’ search for cases. It involves using notifications of disease cases by health facility workers who are not employed specifically to conduct surveillance or the use of routinely collected data generated by organisations as part of their normal day-to-day activities. For example, patients admitted to hospital with fever may have cultures taken from blood or urine to try and find the cause of their fever. The results of these tests, as well as being used for patient care, may also be reported to a passive surveillance programme looking at the incidence of particular bacterial infections. In a passive surveillance system, there is no deliberate stimulation of reporting by reminding health facilities to report on disease events. Such surveillance may be relatively cheap to conduct if it uses existing facilities and systems and so can be implemented across large areas, for example, to include all hospitals in a country. The downside to this passive surveillance method is that the quality, comprehensiveness and timeliness of data collected is difficult to control. Most mandatory reporting requirements fall into this category of surveillance.
One form of passive surveillance is laboratory-based surveillance, where routinely collected laboratory data is reported to the surveillance system to give information on the occurrence of specific diseases.
Example 1: The
Example 2: RESAVIP (Reseau national de Surveillance des Virus Influenza chez le Porc) in France is a passive, event-driven, surveillance of the clinical suspicion of Influenza A in pigs. Influenza A can have severe health and economic impacts for both human and animal public health. These viruses can be zoonotic (that is they are spread between animals and humans) and have an epidemic, or pandemic, potential. Furthermore, pigs are considered reservoirs of human Influenza A viruses and can be an intermediary host for avian influenza viruses. For all these reasons, a system that tracks, for example, the circulation of influenza viruses in pigs can be most useful in the prevention of disease outbreaks. The system described here is not meant to generate prevalence or incidence rates, nor to effectively detect new viral strains, but it does allows veterinary public health professionals to have a good idea of the viral strains circulating in the country and their geographic spread. In practice, veterinarians (note, in France, clinical veterinary services are exclusively provided by private veterinarians) are given specific kits to take samples on farms wherever flu is suspected. Farmers participate voluntarily and anonymously. If Influenza A is detected in the sample by the regional laboratory, it is sent to the reference laboratory for further genetic analysis. The reference laboratory is also in charge of data management, analysis and interpretation of the results. If you have time, see further information on RESAVIP (ESA, 2015). Note that the information on this page is in French.
Activity 5: Reflecting on passive surveillance
a.
All online surveillance systems are passive surveillance systems.
b.
Data submitted to the DHIMS2 are from health departments, healthcare providers, medical facilities and laboratories who obtain the data as part of routine healthcare provision.
c.
Notifiable disease surveillance always employs a passive surveillance methodology.
The correct answer is b.
3.2 Active surveillance
Active surveillance is defined by the act of prompting health facilities (or healthcare practitioners) to collect information on a key indicator (for example, disease event) by undertaking some activity that would not have otherwise taken place. Active surveillance usually requires substantially more time and resources (in contrast to passive surveillance) but captures more complete and detailed data. For this reason, it is often used in conjunction with a specific epidemiological investigation or question, such as when investigating a localised outbreak. Due to active surveillance being resource-intensive, it is used less widely for routine forms of surveillance.
Example: One of the important roles of surveillance is gathering data on how fast a known disease in spreading, which populations it affects and if this picture is evolving. The
The EU’s active surveillance for BSE falls under its
3.3 Syndromic surveillance
Syndromic surveillance can be passive or active and involves gathering routinely collected data on signs, symptoms or clinical diagnoses of disease in human or animal health, when laboratory confirmation of disease is either unavailable or not timely. This methodology is employed in situations where an early warning system is needed, including to identify emerging syndromes and diseases; for example, it can be set up in busy Emergency Departments in hospitals across a country to rapidly detect spikes in seasonal influenza, based on number of people presenting to the Department with symptoms suggestive of possible influenza (for example, report of fever or measured high temperature). Information gleaned from this form of surveillance serves as an early warning flag for the health system, allowing for prompt interventions to mitigate disease spread and adjust health service capacity.
Syndromic surveillance also triggered the alarm bell which later led to the identification of BSE, when the number of neurological syndromes in cattle surged above the ‘usual’ incidence. This methodology is often cheap to implement, in part due to its lack of dependability on laboratory confirmation processes. The focus on signs and symptom data does make systems employing this methodology less accurate for pinpointing the cause of disease. For example, a ‘rash’ could be a sign of anything from dermatitis (i.e. skin inflammation) to a
Example:
3.4 Sentinel surveillance
Sentinel surveillance methodology is often employed in resource-constraint contexts, such as in LMICs, where it is difficult to include all health facilities within a surveillance system. In such circumstances, a limited number of health facilities (or farms, or veterinary clinics or laboratories), often those that already have the capacity to undertake surveillance duties and collect detailed information, are used by the surveillance programme. The type of surveillance undertaken in the sentinel sites may be active or passive. Often incentives are provided to facilities undertaking sentinel surveillance to drive participation. A key consideration is the generalisability of findings from these sentinel sites: how well does the incidence of disease in patients at this hospital (or animals attending this clinic or reared on these farms) relate to the incidence of the disease in the rest of the population in that country?
Example: In Rwanda, in central Africa, sentinel surveillance was used successfully to characterise, for the first time, the
It is important to note that a surveillance system may use methods from more than one type of surveillance. For example, using routinely collected laboratory data from a specified number of sites would be passive, laboratory-based sentinel surveillance.
Activity 6: Reflecting on the types of surveillance methods
Activity 7: Reflecting on the types of surveillance methods
4 AMR surveillance
We have so far discussed examples of surveillance systems and the most common methods they employ to capture data needed in response to a public health question. In this section, we will consider the types of surveillance necessary to capture information about antimicrobial resistance (AMR).
4.1 What is AMR?
AMR occurs when microbes such as bacteria, viruses, fungi and parasites no longer respond to the drugs designed to kill them (WHO, 2023b).
Since the discovery of antimicrobials, starting in the early twentieth Century with the work of Erhlich and colleagues (identification of Salversan for syphilis) and Fleming (initial discovery of penicillin in 1928), millions of lives have been saved through successful treatment of infections. The emergence of resistance, that is, the ability of microbes to resist the action of antimicrobials, is a natural phenomenon which protects microbes from hostile environments. Unfortunately, due to the overuse and misuse of antimicrobials in human, animal and agricultural health sectors, we now see an acceleration in the prevalence of resistant microbes globally. For the purposes of this course, we will be focusing on AMR in bacteria.
AMR is recognised as a serious global threat to health, affecting humans, animals and plants. Surveillance of AMR is crucial to track changes in the incidence and prevalence of AMR at local (for example, community), national (countrywide) and global levels. An AMR surveillance system is defined as ‘a structured and systematic procedure to measure the prevalence or incidence of AMR through continuous or periodical surveillance performed with a defined methodology and with specified indicators’ (Dunne et al., 2000).
4.2 What is the purpose of AMR surveillance?
Data gathered through surveillance allows for the monitoring of local and national patterns of resistance to provide information on the access and use of antimicrobials. Surveillance is also important for early detection of new strains of resistant bacteria (bacteria with novel ways of resisting the action of antibiotics) and to support prompt notification of relevant authorities, allowing for quick investigation and action to mitigate the spread of resistance (WHO, 2021). Because the prevalence of AMR varies considerably from community to community and from country to country, a standardised method of collection and reporting of AMR data is key to allowing meaningful comparisons between levels of resistance in different places and times. The course The problem of AMR discusses these issues in more detail.
Let us examine the types of AMR surveillance systems operating at local, national and global levels. We will discuss what these systems do, how they share information with each other and consider some examples. The courses Introducing AMR surveillance systems and An overview of national AMR surveillance systems discuss these in more detail. The following section is thus an introductory discussion of AMR surveillance systems.
4.3 Different types of AMR surveillance
At the time of writing, there are known to be over 70 different AMR national or multi-national surveillance systems operating in 35 countries, spanning human, animal and agricultural sectors. The vast majority of these (90%) operate at single-country level and are known as ‘national AMR surveillance systems’, with the remainder operating across several countries. Let us discuss some examples. Keep an eye out for information on the benefits of these systems, their precise purpose, the type of data they collect, how they link surveillance data to practice (for example, designing of interventions), and whether they operate at a local, national or global level (Diallo, 2020). Bacterial AMR surveillance systems may look at types of bacteria and resistance patterns, and/or they may collect data on antimicrobial consumption and use.
Example 1: The
- Streptococcus pneumoniae
- Haemophilus influenzae
- Salmonella enterica serotype Typhi
- Non-typhoidal Salmonella species
- Staphylococcus aureus
- Escherichia coli
- Klebsiella pneumoniae
The system uses clinical samples which are sent to medical laboratories for confirmation of the presence of disease-causing bacteria. When these bacteria are identified, data are collected on which antibiotics the bacteria are resistant to (
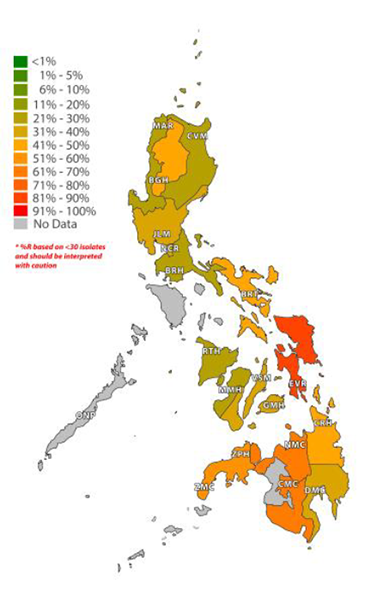
Figure 3 shows the geographic distribution of oxacillin antibiotic resistance in one of these bacteria – Staphylococcus aureus (which causes infections such as pneumonia (in the lungs), endocarditis (in the heart) and bacteraemia (in the blood) – in the Philippines in 2023. These data show that in several regions of the country, there are moderate (11–25%), high (26–50%) or very high (>50%) levels of penicillin resistance occurring in this medically important bacteria. This AMR surveillance is, therefore, key to understanding where in the Philippines resistant strains are most commonly found and hence where public health interventions relating to AMR in this bacteria should be targeted.
Example 2:
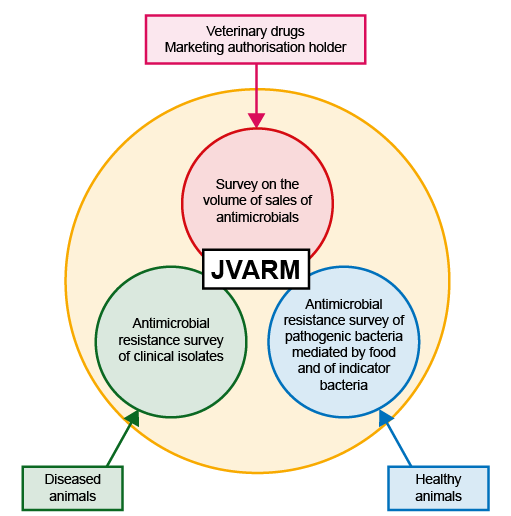
JVARM aims to collect two types of data:
- Data on AMR among bacteria isolated from healthy food-producing animals and those from diseased animals.
- Data on the sale of antimicrobials in the animal health sector. These type of data allows countries to monitor the volume of antimicrobials used by the country, which is a useful indicator, as high sale of antimicrobials often points to their overuse, something countries are keen to prevent. Overuse likely contributes to increased prevalence of bacterial AMR. This concept of measuring ‘antimicrobial consumption’ (AMC) will be discussed in depth in the course Introducing AMR surveillance systems.
Data on AMR among bacteria are gathered by way of collecting samples from healthy animals as well as from diseased animals on a continuous basis. Animal health settings where these data are collected include farms, veterinary practices and slaughterhouses. Data on the following bacterial species are collected in this system:
- Salmonella species
- Campylobacter jejuni
- Campylobacter coli
- Escherichia coli
- Enterococcus faecium
- Enterococcus faecalis
- Klebsiella pneumoniae
Data on the sale of antimicrobials (in kg of antimicrobials) are collected annually in Japan via the
We hope the above examples give you an introduction to the types of AMR surveillance systems that exist. These systems vary in what their purpose is, the kind of data they collect, their sources of data and how they add to the knowledge base. The common feature of these surveillance systems is that they allow authorities to focus their efforts in mitigating the spread of AMR.
5 Comparing surveillance data between sectors
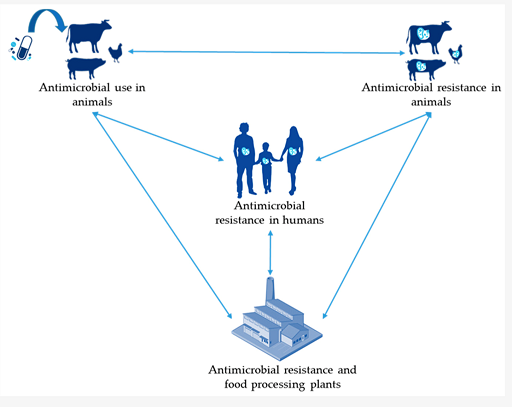
Antimicrobial resistance is a health issue with cross-sector repercussions. It affects the human, animal and agricultural health sectors. Antimicrobials are widely used across all these different sectors to treat infections and prevent diseases (human, animal and agricultural sectors) and to promote growth (animal and agricultural sectors). The use of antimicrobials in one sector has an impact on that sector and on the other sectors. For example, a build-up of antibiotic resistance in the animal sector has an impact on human health by way of animals consumed as food (or food-producing animal products). Consequently, the build-up of antibiotic resistance in humans leads to the contamination of the environment, including water bodies that may serve as drinking water to animals and humans (Figure 5). This inter-sectoral link between the human, animal, agricultural sectors and the environment is critical and is acknowledged by the WHO’s ‘One Health’ approach to AMR. The ‘One Health’ approach aims to drive concerted and collaborative efforts, across these different sectors, to mitigate the threat posed by AMR. You can learn more on why and how a One Health approach can be taken to tackle the issue of AMR in the course Introducing a One Health approach to AMR.
It is, therefore, of critical importance that AMR surveillance data can be compared across these different sectors. This involves being able to initially compare indicators:
- Antimicrobial use in humans
- Antimicrobial use in animals
- Prevalence of AMR in humans
- Prevalence of AMR in animals
From a surveillance system point-of-view, to gather these different types of data is challenging as they relate to very different types of information, which in turn rely on different sampling techniques, laboratory infrastructure and use different definitions. Where these data do all exist in a country, it is often very difficult to compare data from animal to data from human sector.
In Section 4, we discussed the example of the JVARM surveillance system, which collects data on antimicrobial sales in the veterinary sector and AMR data from healthy and diseased animal samples. Since 2012, JVARM has collaborated with the
- Escherichia coli
- Enterococcus faecalis
- Enterococcus faecium
- Pseudomonas aeruginosa
- Klebsiella pneumoniae
- Corynebacterium sp.
- Coagulase-negative staphylococci
- Staphylococcus aureus
- Proteus mirabilis
- Enterococcus sp.
- Streptococcus agalactiae
- Alpha-haemolytic Streptococci
- Enterobacter cloacae
In order to compare AMR data across sectors, the data for Escherichia coli (E.coli) from healthy animal samples collected by JVARM are routinely converted into a format comparable to the AMR data for E.coli from hospital samples. E.coli is a good example of a species of bacteria that commonly causes disease in both animals and humans. This step allows cross-sector comparison of trends in AMR for a key organism of importance in both sectors.
Figure 6 shows one such comparison in trends for a particular type of AMR (third-generation cephalosporin-resistant bacteria), using data from Japan. The analysis looks at the proportion of all samples collected with this type of AMR over a period of time (for example, a year) and compares it across the human and animal sectors. Animals reared for consumption include pigs, beef cattle and broilers (chicken reared for meat). This graph tells an interesting story, so take a few minutes to look at the graph before you read the interpretation below.
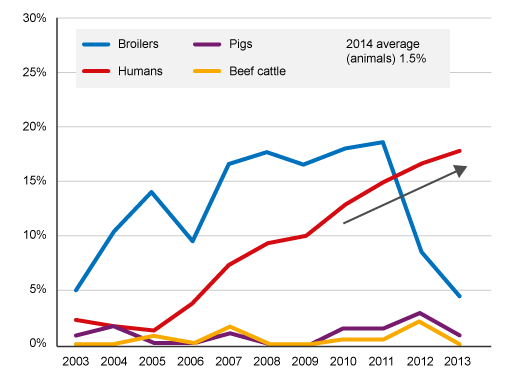
The analysis found a high level of third-generation cephalosporin resistance (>10%) bacteria carried by broiler chickens from 2004 to 2011, reaching around 18% by 2011. The level of this type of resistance in bacteria carried by pigs and beef cattle remained low (<3%) over the same period. From 2005 onwards, there was a progressively rising level of this type of AMR in humans, which could be related to ‘cross-over’ of this type of resistance from broiler chickens to humans.
After 2011, there is a notable decrease in this form of AMR in samples taken from broiler chickens. This analysis suggests this decrease was due to the withdrawal of off-label (or generic) antimicrobials from use in the broiler chicken industry in Japan. If you want, you can read more about this analysis. This is an example of the importance of cross-sector surveillance and linked interventions to mitigate the spread of AMR. However, the downward trend in resistance in bacteria isolated from broiler chickens after 2011 is not matched by a similar fall in the human sector, suggesting that other factors were also driving the upward trend in AMR in humans.
6 Reflecting on your role
Consider the following activity to help you reflect on your role within surveillance systems in your work. Don’t worry if you don’t currently work in surveillance. You can use the following activities and questions as a guide to what your role in surveillance would be.
Activity 8: Describe the aspects of your role that relate to surveillance
Now look at Figure 2 in the article ‘Antibiotic resistance surveillance systems: a review’ (Diallo et al., 2010), which illustrates an ‘ideal’ AMR surveillance system of the (distant!) future. In this system, AMR surveillance data from the human, animal, agricultural and environmental sectors are all collected in a standardised way, from multiple data sources. This includes information from hospitals, laboratories, veterinary practices, farms, etc. These AMR data are analysed and the results are compared across sectors to understand how use of antimicrobials in one sector is leading to increases in resistance in this sector and/or another sector. The right-hand side of the figure – illustrating the data sources, data analysis and report-generation steps, could actually be describing any surveillance system – these are the standard elements of work for any form of disease surveillance.
Reflecting on your role, where do you find yourself in the ‘ideal’ AMR surveillance system in the article? Consider the following questions:
- Do you work in the human health, animal health or the wider environmental sector? If not, which of the following is most relevant to your role, and how does it reflect wider surveillance efforts?
- Hospital
- Farm
- Pharmacy
- Veterinarian
- Laboratory
- Policy maker
- Public health sector
- Veterinary public health sector
- Other?
- Do you work with samples from humans or animals or both?
- Do you take part in any of the following activities?
- Collection of data? What kind of data?
- Do you take part in data analysis? Do you calculate the incidence and prevalence of infections or disease?
- Do you generate or communicate the findings of analysis via reports? Who are these reports for? How often are they generated?
- Is your role within a team that conducts surveillance? Did you note ‘Yes’ against any of the above questions on ‘taking part in data collection, analysis, reporting’? If so, do you carry out these duties as part of a surveillance team?
- What kind of surveillance activities do you/your team carry out?
- Did you note ‘No’ to all of the above questions on ‘taking part in data collection, analysis, reporting’? If so, reflect on the kind of surveillance systems in your city, region or country. What kind of data do they collect? What is the surveillance question being asked? Is it an active, passive, sentinel or syndromic surveillance system?
Consider writing down the answers to the above questions in your blog space and discussing answers with your fellow leaners.
7 End-of-course quiz
Well done – you have reached the end of this course and can now do the quiz to test your learning.
This quiz is an opportunity for you to reflect on what you have learned rather than a test, and you can revisit it as many times as you like.
Open the quiz in a new tab or window by holding down ‘Ctrl’ (or ‘Cmd’ on a Mac) when you click on the link.
8 Summary
In this course, you have learned about surveillance, including the history of surveillance, the purpose of surveillance and some of the important terminology used. You have read about a wide range of examples of surveillance programs for infectious and non-communicable disease, both in human and animals around the world. You have learned about different methods employed to carry out surveillance, and you have been introduced to the concept of AMR surveillance. You have learned that a well-designed surveillance program is based around a specific public health question or purpose and should be linked to appropriate intervention activities for the relevant disease(s).
You should now be able to outline and describe:
- the purpose of surveillance
- key surveillance terms and concepts
- the different types of surveillance
- the different methods of undertaking surveillance
- the purpose of AMR surveillance
- the different types of AMR surveillance
- the importance of being able to compare surveillance across sectors.
Now that you have completed this course, consider the following questions:
- What is the single most important lesson that you have taken away from this course?
- How relevant is it to your work?
- Can you suggest ways in which this new knowledge can benefit your practice?
When you have reflected on these, go to your reflective blog and note down your thoughts.
Activity 9: Reflecting on your progress
Do you remember at the beginning of this course you were asked to take a moment to think about these learning outcomes and how confident you felt about your knowledge and skills in these areas?
Now that you have completed this course, take some time to reflect on your progress and use the interactive tool to rate your confidence in these areas using the following scale:
- 5 Very confident
- 4 Confident
- 3 Somewhat confident
- 2 Slightly confident
- 1 Not at all confident
Try to use the full range of ratings shown above to rate yourself:
When you have reflected on your answers and your progress on this course, go to your reflective blog and note down your thoughts.
9 Your experience of this course
You’ve now reached the end of this course. If you’ve enrolled on a pathway, please go back to the pathway page and tick the box to confirm that you’ve completed this course. On the pathway page you’ll see both your progress so far as well as the other courses you need to complete in order to achieve your Certificate of Completion for that pathway.
Now that you have completed this course, take a few moments to reflect on your experience of working through it. Please complete a survey to tell us about your reflections. Your responses will allow us to gauge how useful you have found this course and how effectively you have engaged with the content. We will also use your feedback on this pathway to better inform the design of future online experiences for our learners.
Many thanks for your help.
References
Acknowledgements
This free course was collaboratively written by Siddharth Mookerjee and Patrick Murphy, and reviewed by Alexander Aiken, Claire Gordon, Natalie Moyen, Peter Taylor and Hilary MacQueen. The course was reviewed and updated by Priya Khanna, Hilary MacQueen, Clare Sansom and Rachel McMullan in 2025.
Except for third party materials and otherwise stated (see terms and conditions), this content is made available under a Creative Commons Attribution-NonCommercial-ShareAlike 4.0 Licence.
The material acknowledged below is Proprietary and used under licence (not subject to Creative Commons Licence). Grateful acknowledgement is made to the following sources for permission to reproduce material in this free course:
Course image: elen1/123RF
Figure 1: Based on Chiolero A., Buckeridge, D. (2020) Glossary for public health surveillance in the age of data science,J Epidemiol Community Health, 2020;74:612-616. This file is licensed under a Creative Commons Attribution-NonCommercial 4.0 International (CC BY-NC 4.0) license, https://creativecommons.org/ licenses/ by-nc/ 4.0/
Figure 2: Based on Chiolero A., Buckeridge, D. (2020) Glossary for public health surveillance in the age of data science,J Epidemiol Community Health, 2020;74:612-616. This file is licensed under a Creative Commons Attribution-NonCommercial 4.0 International (CC BY-NC 4.0) license, https://creativecommons.org/ licenses/ by-nc/ 4.0/
Figure 3: Antimicrobial Resistance Surveillance Program, 2024.
Figure 4: Adapted from Japanese Veterinary Antimicrobial Resistance Monitoring System (JVARM), https://amr-onehealth.ncgm.go.jp/ en/ surveillance/ 34/
Figure 5: Bennani, H. et al. (2020) Overview of Evidence of Antimicrobial Use and Antimicrobial Resistance in the Food Chain, MDPI, Antibiotics 2020, 9(2), 49; https://doi.org/ 10.3390/ antibiotics9020049. An open access article distributed under the terms and conditions of the Creative Commons Attribution (CC BY) license, http://creativecommons.org/ licenses/ by/ 4.0/
Figure 6: Adapted from Japanese Veterinary Antimicrobial Resistance Monitoring System (JVARM), https://amr-onehealth.ncgm.go.jp/ en/ surveillance/ 34/
Every effort has been made to contact copyright owners. If any have been inadvertently overlooked, the publishers will be pleased to make the necessary arrangements at the first opportunity.