Use 'Print preview' to check the number of pages and printer settings.
Print functionality varies between browsers.
Printable page generated Tuesday, 7 July 2026, 11:11 PM
Module 4: Water activity in seeds
Introduction
Welcome to the fourth module of this online course. In previous modules, you learned how seeds naturally lose water while maturing on the parent plant, and that this drying has an impact on seeds’ longevity in storage. In this module, we will take a deep dive into the mechanisms for this.
Genebanks invest a lot of effort in controlling the amounts of water in seeds. Why go to this trouble? In this module you will learn what happens inside seeds as water enters and leaves, and why movements of water can have so much impact on seed longevity and viability.
Variables such as temperature, gaseous environment and moisture history can also affect movements of water in and out of seeds, and either promote or damage the seeds’ ability to germinate once they come out of storage. You can save time and money by monitoring the amount of water in seeds carefully.
By the end of this module, you will be in a good position to apply what you have learned to your own work. We will give you the opportunity to read about the science of this in more depth in our ‘Useful publications’ section.
By the end of this module, you should be able to:
- Describe what changes take place inside a seed when water enters and leaves it.
- Give examples of different drying strategies that can help maintain viability during storage.
- Explain the effect of different combinations of temperature, humidity and moisture history on seeds.
- Calculate the amount of water in a sample of seeds.
- Describe new techniques for measuring water activity and equilibrium relative humidity.
- Explain how genebanks can improve their practice based on research evidence.
- Evaluate the procedures in your own genebank’s workflow.
Overview of genebank processes
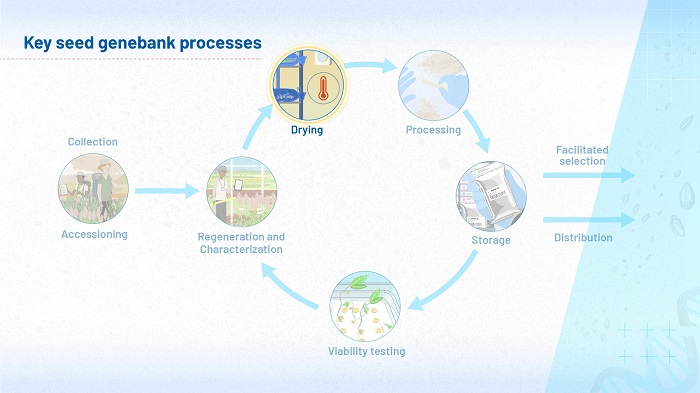
The focus of module 4 is drying, as Figure 1 shows. Although seeds start to dry in the field, as far as ambient conditions allow, once they enter a genebank they are dried further, under the controlled conditions in the genebank’s drying rooms. The low moisture content they reach in the drying rooms must be maintained during the time seeds are processed and packed, so that by the time they enter the active or base collections, the seeds meet strict parameters of temperature and humidity.
Genebanks carefully monitor the moisture content of seeds because this tells us a lot about their physiological status – whether their metabolisms are barely ticking over or gearing up for germination, what processes are going on inside their cytoplasm. An important practical application of this measurement is that the moisture content tells the genebank scientists when the seeds are ready to go into storage.
However, conventional methods of measuring moisture content are destructive and wasteful. In this module, we will explore new and cost-effective ways of measuring and controlling the behavior of water in seeds.
Some definitions
The amount of water inside a seed is its moisture content: seeds containing a lot of water are more metabolically active than dry seeds. There are various ways to measure moisture content, but they are often destructive.
The fresh weight of a seed sample is easy to measure, but it varies with moisture content. The dry weight of a seed sample is an estimate of the sample’s weight when all the water has been removed.
Another measure of seed moisture status is water activity (aw). It measures the availability of ‘free water’ inside the seeds, and therefore the type of reactions, including damaging ones, that can occur.
Relative humidity is a measure of how much water vapor there is in the air, compared to the maximum amount of water vapor the air can theoretically hold at the same temperature (the saturation point).
Once seeds have reach equilibrium with the air around them, they reach equilibrium relative humidity. Seed equilibrium relative humidity is approximately equal to the water activity (aw) multiplied by 100.
As you increase the relative humidity, water enters the seed. As you decrease the relative humidity, water leaves the seed. These responses can be plotted as an isotherm, showing the relationship between seed moisture content and equilibrium relative humidity at any given temperature; a relationship that controls whether seeds gain or lose moisture.
Dry seeds take up moisture in a process called imbibition. As long as there is no hard seed coat acting as an impermeable barrier, they can take water up very quickly.
What has happened to a seed in the past makes a difference to how seeds take up water at any given time. For instance, a dry seed takes up water slightly differently from a moist seed losing water. This is called hysteresis.
Measuring water in seeds
Measuring the amount of water in seeds is helpful at various stages of a seed’s development. In the field, it is important to measure the moisture content when assessing how close seeds are to harvest and dispersal. For seeds that have already spent time in storage, measurement can yield useful information about whether the seeds are alive and how close they are to germination.
The traditional approach, commonly used in the seed trade, is to find out the moisture content using the gravimetric (oven) method. The idea is to dry out seeds completely, then measure the change in weight, which is assumed to be water that has evaporated away. This drying is done in an oven, either at a temperature of 103°C or 130°C. It is a destructive process, requiring large samples of seeds, and may be regarded as rather wasteful, given the effort and resources genebanks devote to seed conservation.
Activity 1
Allow 5 minutes for this activity
This activity walks you through how to calculate moisture content of seeds using the gravimetric method.
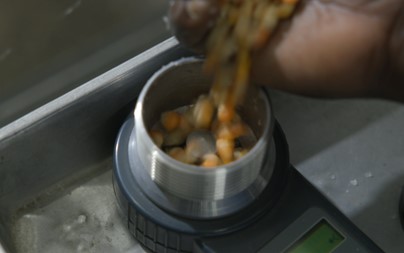
A scientist places a sample of fresh seeds into a dry crucible and weighs them.
- Weight of crucible: 50g
- Weight of crucible plus seeds: 55g
What is the fresh weight of the seeds? Use the text box below to write your answer, before pressing ‘reveal’ to check you got it right.
When you are ready, press 'reveal' to see our comments.
Discussion
Fresh weight = 5g
The scientist places the seeds in the oven at 103°C for 17 hours. Next, the scientist cools the sample for one hour, and weights it again.
- Weight of crucible plus seeds after drying in oven: 54.4g
Assuming the weight difference is entirely due to water evaporation, what is the dry weight of the seeds? Use the text box below to do your own calculation before checking the answer.
When you are ready, press 'reveal' to see our comments.
Discussion
dry weight = 4.4g
The moisture content can be expressed as a percentage of fresh weight:
What is the moisture content of this sample? Write your answer in the text box below before checking.
When you are ready, press 'reveal' to see our comments.
Discussion
Moisture content = 12 % f. wt.
Pause for reflection
Can you think of any reason why these calculations of dry weight, moisture content and water content, based on the gravimetric method, may not be accurate? Use the text box to write your thoughts.
When you are ready, press 'reveal' to see our comments.
Discussion
The gravimetric method is based on an assumption that all the weight loss is due to evaporation of water. However, this may not be the case: some of the weight loss could be due to loss of volatile components of the seeds.
Alternatives to the gravimetric method
A moisture meter provides an alternative method of measuring the amount of water in seeds. Instead of attempting to address the question directly, a moisture meter measures the moisture in seeds indirectly, using a measure such as capacitance or conductance of the seeds. Moisture meters are quick and easy to use. They can be non-destructive, and they do not require large samples. They do, however, require regular calibrating against the oven method.
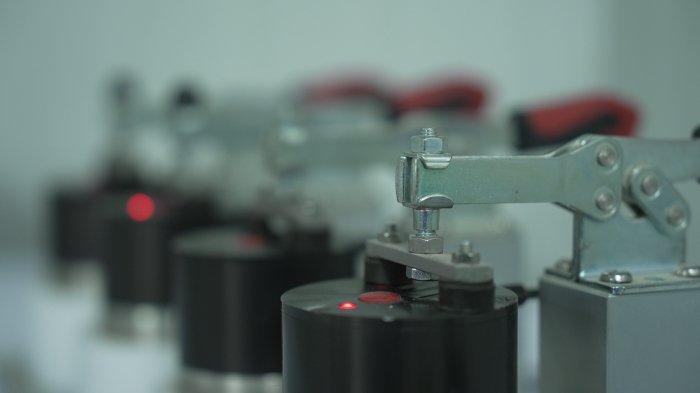
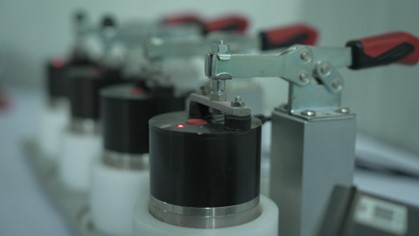
A water activity meter is based on the idea that a sample of seeds will always reach equilibrium with the air around it. It is quick to use, and although more expensive than the moisture meter, it is more reliable. Water activity meters measure the equilibrium of water vapor in the air around the seeds rather than removing water from the seeds themselves, so are completely non-destructive. Like the moisture meter, water activity meters need to be calibrated regularly.
Watch this video about measuring water in seeds. It explores the different contexts in which genebanks take measurements of water in seeds, and the different techniques they use to do so. As you watch, think about the different types of information about the behavior of water in seeds that scientists at IITA and IRRI need to know.
Transcript: Video 1: measuring water in seeds
Please write your comments about what kinds of information scientists in the video learn from their measurements of water in seeds. You should spend up to ten minutes on this. If your reflections on the video raise any questions, please post them on the Forum, where the course moderators will be able to help you.
When you are ready, press 'reveal' to see our comments.
Discussion
In this documentary, you saw measurements of water being used to obtain different types of information. In the field, they are used to help determine the best time to harvest, especially in climates where there is only a narrow window in which it is possible to harvest. They are also used in the drying room, to determine when the seeds are dry enough to go into storage. You may have noticed how portable and convenient the moisture meter is for these two purposes. The water activity meter, by contrast, gives a different type of information: a more accurate idea of the kind of biochemical reactions going on inside seeds. It can tell you, for instance, when seeds are gearing up for germination, or when they are quiescent, and in a good state for storage.
Why does water activity matter?
Water activity is important because water is required to promote the aqueous (water-based) reactions that are essential to the seed’s metabolism. The type of reactions that can take place depends on the amount ‘free water’ inside the seeds. If the moisture content is high, reactions can take place readily within the seed, but in the context of a genebank, rates of spoilage also tend to be higher. If the moisture content is low, this reduces the scope for chemical reactions to go on within the seed, meaning the seeds can be stored for longer.
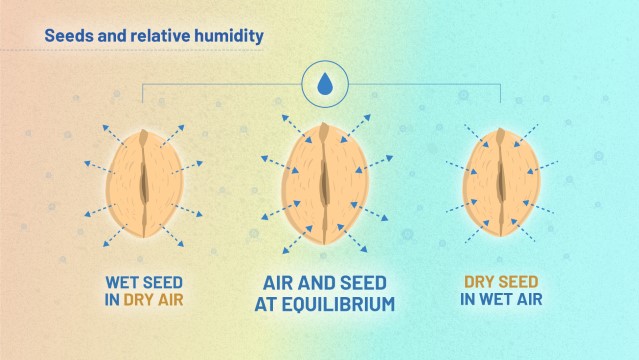
Most seeds are hygroscopic (they readily take up and retain moisture). Water will move in and out of the seed in order to reach equilibrium with the humidity of the surrounding air. If you consider the seed and the air around it as a system, this system will tend towards equilibrium between water in the air and water in the seed, as Figure 2 shows.
This is important because seeds behave in different ways, depending on their moisture content. We will look at the underlying mechanisms later, but let’s first think about visible behavior of the seeds. Table 1 summarises how seeds are likely to behave under conditions of low, medium and high moisture content:
| Low moisture content | Assuming temperature is constant, seeds with low moisture content survive for a long time because their metabolism is barely ticking over. They will not germinate. |
| Medium moisture content | As the seed’s moisture content increases, rates of many aging reactions increase, resulting in damage to nucleic acids, proteins and lipids. |
| High moisture content | Seeds with high moisture content are fully metabolically active. They are able to respire if oxygen is available, and to gear up for germination, including the repair of damaged macromolecules. If environmental conditions are appropriate, they will show their viability. In a storage setting, relative rates of spoilage may be higher, because of oxidation and the growth of yeasts and bacteria.
|
Table 1: changes in seed behavior with moisture content
At different stages in a genebank’s operations, it is desirable for seeds to behave in different ways. During storage, minimal metabolism is important, whereas during regeneration, the seeds must be metabolically active. To this extent, controlling the moisture content of seeds is key.
Reaching equilibrium
Genebanks rely on the movement of water molecules between the inside of a seed and the air around it. The relative humidity of the air, a measure of how moist the air is, has a direct influence on how much water there will be inside seeds. The relative humidity of the air can be measured using a hygrometer.
When seeds are dried in preparation for storage, manipulating the relative humidity of the air around them can ensure that an equilibrium is reached where the seeds are dry enough to survive well in storage. When they are taken out of storage for regeneration, moistening them can give the seeds a suitable water content to germinate. Temperature is also important, but assume for the moment that the surrounding temperature is a constant 20°C.
Watch the animation to find out how water moves in and out of seeds as the relative humidity of the surrounding air changes.
Transcript: Video 2: equilibrium rehydration
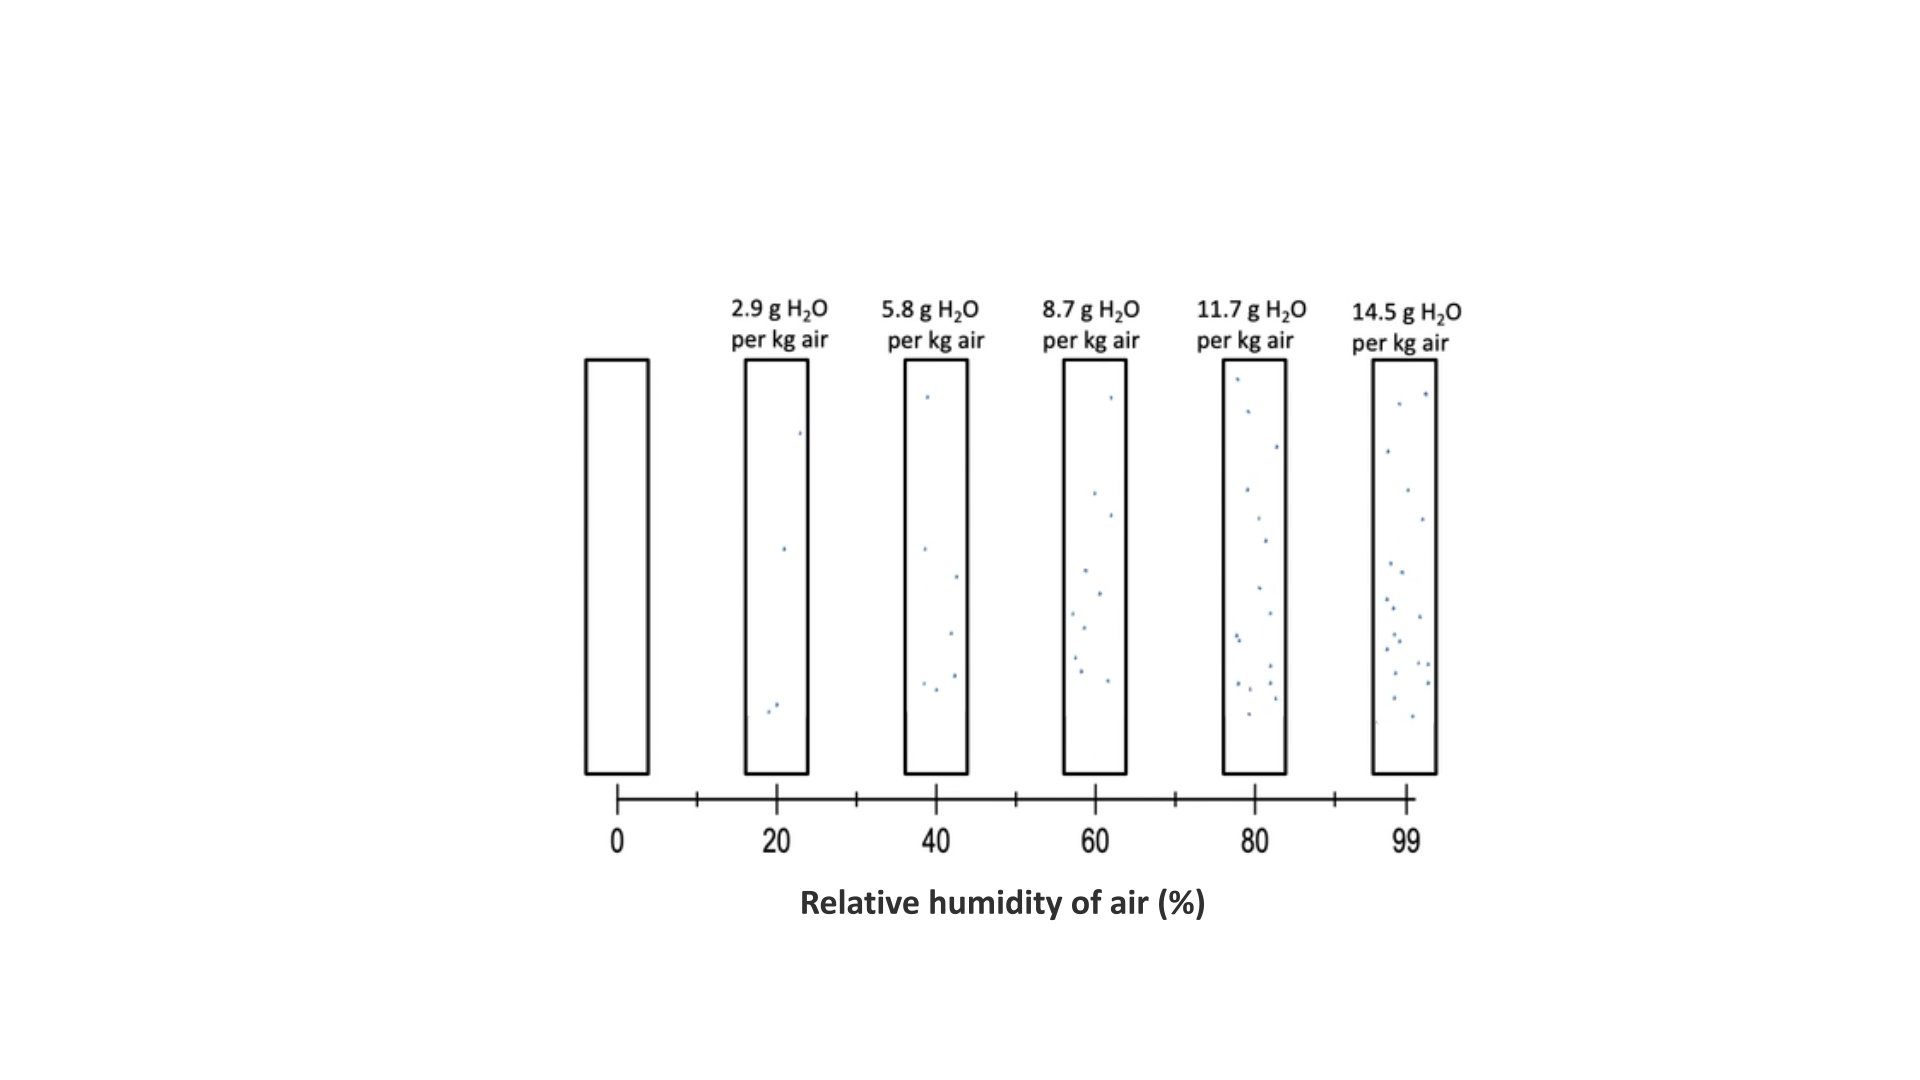
Imagine this is a container holding one kilogram of dry air.
As you add water vapour to the air, the water molecules move among the air molecules.
As you add more water vapour, the relative humidity increases: there are more water molecules in the air.
Until you reach saturation - the air cannot hold any more water vapour.
What happens when you add some dry seeds to this system?
Like the air, the seeds contain some water molecules.
Even at equilibrium, some of the water molecules in the seeds have enough energy to move out of the seed and into the air.
But as long as the relative humidity of the air does not change, equilibrium is maintained between water in the seed and water in the air.
Here, 5.5% of the wheat seed’s fresh weight is water.
If you increase the relative humidity of the air, more water will move into the seed.
At 20°C, when there’s five point eight grams of water in the air, eight point one percent of the seed’s fresh weight is water.
Every increase in the relative humidity of the air brings a corresponding increase in the water in the seed.
When there’s 14g of water in the air, more than 20% of the fresh weight of the seed is water.
In many types of seed, you can easily see the difference, as they are visibly larger.
This seed is now ready to germinate.
Please use the box below to describe how changing the amount of water in the air surrounding seeds changes the amount of water inside those seeds. You should spend up to ten minutes on this. If your reflections on the animation raise any questions, please post them on the Forum, where the course moderators will be able to help you.
When you are ready, press 'reveal' to see our comments.
Discussion
The amount of water in the surrounding air reaches equilibrium with the amount of water vapor in the seeds. By manipulating the relative humidity of the air around a batch of seeds, you can alter the amount of water available for biochemical reactions inside those seeds. The fresh weight of the seeds increases as they take in more water. The animation shows hydration: the reverse process, dehydration, is also possible.
Relative humidity of air and seeds
Earlier in this module, you learned from the section entitled ‘Some definitions’ that relative humidity is a measure of how much water vapor there is in the air. Relative humidity (RH) is expressed as a percentage :
When seeds are placed into air of a given RH and a given temperature, the water inside seeds reaches a measurable equilibrium with the relative humidity of the surrounding air, creating a water vapor pressure around the seeds. This can be measured by comparing with what the water vapor pressure would have been, had the air been above pure water. This is called the equilibrium relative humidity (eRH). It can be expressed as a percentage, from zero (a completely dry seed in wet air) to one hundred percent (a saturated seed in dry air).
An alternative way of expressing this dynamic is to divide eRH by one hundred, creating a scale of 0 to 1 – this is the related concept of water activity (aw).
The concepts of equilibrium relative humidity (eRH) and water activity (aw) give us important information. They indicate the type of reactions that can occur within seeds. They can predict how the seeds will age: for instance, seeds with an eRH of 20% will age slowly, whereas those with an eRH of 70% will age faster. By the time eRH has reached 98%, the seeds are ready to germinate. Additionally, eRH predicts how much the seed is respiring – significant rates of respiration only occur when eRH is greater than 85%.
This can be plotted in a graph called an isotherm. Figure 3 (below) plots the moisture content of seeds at different levels of water activity (aw). As the water activity increases, so does the moisture content. This creates a sigmoid curve that models the behavior of seeds, both in storage and in the laboratory.

POLL: you decide
Is equilibrium relative humidity a more useful measure than moisture content when it comes to managing water in seeds?
Let’s see what you and your course colleagues think. Please express your opinion by following this link to the poll.
The results of this poll will be shared with your course colleagues and may be discussed at the next live event.
Technical tip
We recommend you open this in a new tab or window (right mouse click or long press) to enable you to easily return to this page.
Behavior of water inside seeds
In dry seeds, water is chemically bound to macromolecular surfaces or other biological interfaces by ionic bonding. There is little scope for this water to participate in aqueous reactions. The dark blue area of Figure 4 (below) shows how the amount of water locked into the seed in this way increases steeply when a seed is very dry, then remains relatively stable as more water enters the system.

As the moisture content of the surrounding air increases, more water can enter the seed. But the way this water is held is likely to be different: weakly bound, clustered round large molecules in polar groups with low affinity to the large molecules. Although still associated with large molecules inside the seed, there is more scope for this water to break free in its H2O (molecular) form. The mid-blue area of Figure 5 (below) shows how the proportion of weakly bound water increases as more water becomes available, while the proportion of strongly bound water does not increase.

As the moisture content of the air increases further, the additional water that enters the seed no longer needs to be chemically bound within the seed tissue: it is free to move around, and forms water-to-water bonds between freely moving water (H2O) molecules. The light blue area in Figure 6 (below) shows changes in the amount of freely-moving water. This type of water is both able to support aqueous biochemical reactions, and to escape out into the surrounding air.

This model of water binding is somewhat simplistic; in reality, binding does not follow such a rigid sequence. But it is helpful to understand how the water in the seed influences the processes that can occur inside.
Biochemical reactions in seeds
So far, you have learned that water is held within a seed in different ways, depending on the amount of water already within that seed. This in turn can affect the type of metabolic reactions that can go on inside the seed. By plotting the isotherm, you can see these as predictable, real-world differences.
Look at Figure 7 (below), which shows three distinct ‘regions’ along the x-axis of the isotherm. These are not just lines on a graph. They relate to observable differences in metabolic reactions that go on inside the seeds. Metabolism is limited when eRH is less than 15%: we call this ‘region I’ of the isotherm. More reactions can take place at an eRH between 15% and about 80%: we call this ‘region II’. Metabolic reactions inside seeds ramp up again in ‘region III’, when eRH rises above 80%.

Activity 1
Allow 5 minutes for this activity
Examine Figure 7 carefully, then try to match the three regions to the most relevant descriptions of the behavior of water for each. There will be more than one interpretation associated with each region. Try to do the exercise yourself first, before looking at our response.
Regions:
- Region I
- Region II
- Region III
Descriptions:
- a. moisture content increases rapidly at first, then tails off as eRH increases
- b. more water is freely available than in any other region
- c. water inside seeds may be strongly bound, loosely bound or free H2O
- d. most water is strongly bound inside seeds
- e. increase of moisture content accelerates as eRH increases
- f. moisture content increases slowly as eRH increases
When you are ready, press 'reveal' to see our comments.
Discussion
In region I, moisture content and eRH are both low. Most water inside seeds is strongly bound, so there is little water available for aqueous reactions. In region II, moisture content flattens out while eRH continues to increase. Inside seeds, there is weakly bound water and some freely circulating water, which increases the scope for certain types of metabolic reactions. In region III, relatively high quantities of freely available water allow ever more water-based reactions to take place.
Region I
a. moisture content increases rapidly at first, then tails off as eRH increases
d. most water is strongly bound inside seeds
Region II
c. water inside seeds may be strongly bound, loosely bound or free H2O
f. moisture content increases slowly as eRH increases
Region III
b. more water is freely available than in any other region
e. increase of moisture content accelerates as eRH increases
Gearing up for germination
In viable seeds, all sorts of chemical reactions take place in preparation for germination. It is instructive to map the different types of reactions onto three different regions of the isotherm, as we have done in Figure 8 (below):

Figure 8 shows the types of reactions that can occur in food products. It is known as a ‘food stability diagram’, and is relevant to us, since many food products are derived from seeds such as grain. In region I, where aqueous water is scarce, reactions include lipid oxidation, which does not require a lot of free water. Lipid oxidation falls off in region II, in favor of enzymatic and non-enzymatic reactions, which require more water. These reactions reach their highest rates in region III. This enzymatic activity allows the seed to carry out important metabolic processes including respiration, repairing aging-induced damage and preparing for germination.
Imbibition
When seeds have ready access to water, they take it up relatively rapidly, in a process called imbibition. This is a different process to that shown in the isotherm, but it usually begins in region II. Imbibition is an essential prerequisite for germination, since it allows the seed to take in sufficient water for the chemical changes that are going to occur. When it reaches region III of the isotherm, the radical emerges (embryonic root), and the seedling starts to grow, while the moisture content of the seed continues to increase.
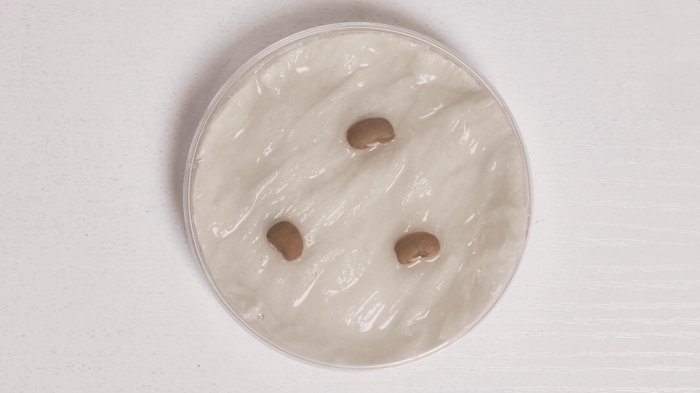
Watch the timelapse video, which shows imbibition in three cowpea seeds. Notice how the size of the three cowpeas increases visibly as water rushes in.
Transcript: Video 3: imbibition in cowpea seeds
This video shows a demonstration of water uptake (or imbibition) in cowpea seeds.
The footage was filmed over twenty-four hours, and sped up using time-lapse technique. You can see the seeds visibly swelling, as the water enters.
There is no narration or commentary over this footage.
So far, we have looked at patterns typical of orthodox seeds. Orthodox seeds tolerate drying to low moisture and their longevity increases as moisture content is reduced over region II. However, not all seeds are this accommodating. Recalcitrant seeds die if they are dried below region III.
Other factors influencing water activity
You might be wondering why there are so many different ways of measuring the amount of water inside a seed: moisture content, eRH and water activity. In the Genebank Standards, equilibrium relative humidity (eRH) is considered the best measurement for drying, because it is independent of small differences which can affect moisture content. Let’s go through these.
Oil within seeds
The moisture content of a seed can vary with the oil content – in general, the lower the oil content, the greater the amount of water a seed can take in. This means crops containing more or less oil behave differently at the same moisture content. By contrast, equilibrium relative humidity is independent of these differences. Figure 9 (below) shows the isotherms of four different types of seed with increasing oil contents - wheat, soy, lettuce and peanut. Use a ruler to check which region each of these crops is in at any given moisture content.
For example, if you rule a horizontal line across the graph corresponding 10% moisture content, it crosses the curve for wheat seeds in the middle of region II (at about 40% eRH). Here we can expect moderate rates of aging reactions. In groundnut on the other hand, still at 10% moisture content, the seeds are already in region III of the isotherm (>90% eRH) and progressing towards germination.

Different areas of tissue within a seed can also have different oil contents: neem has a greater oil content in the cotyledons than in the embryo, therefore the water content in the embryo tends to be higher. This means that eRH is preferable to moisture content and is given as the best measure of the amount of water in seeds in the Genebank Standards.
Temperature and pressure
What temperature is best for drying? This is a balancing act for genebanks (see Figure 10, below). Faster drying can be achieved at higher temperatures, but higher temperatures also bring on physiological aging, which is reduced at lower temperatures.
In theory, pressure could also affect water in seeds, although in reality, temperature tends to be more of a consideration for genebanks than pressure, because in most genebank situations, pressure is unlikely to deviate far from atmospheric pressure.

Hysteresis
The movement of water in and out of seeds varies, depending on whether the seed is taking up (adsorbing) or letting go (desorbing) water. As you learned in module 3, seeds that come directly from the field are likely to be losing water (desorbing), whereas seeds that have been dried, stored, and are being taken out of storage, are likely to be adsorbing.
A seed that has once been dried may also be less efficient in taking up water. This means that it is helpful to know the moisture history of a seed when trying to predict how it will take up water.

The effects of species, temperature and hysteresis means that it can be challenging to compare the longevities of seeds dried and stored under different conditions. For instance, as Figure 12 (below) shows, both moisture content and eRH differ, depending on whether seeds are drying at 20°C or 45°C.

The seed information database
In previous modules, you used the Seed Information Database to search for information about a seed, and to predict its viability. Now you are going to explore another useful tool that allows you to convert from RH to eRH.
Follow the link to the ‘equilibrium moisture content calculator’ of the Seed Information Database. Use the drop-down list to look up the oil content of almond (Prunus amygdalus), then enter the drying temperature and relative humidity usually used in your genebank. This should show you almond’s equilibrium moisture content under those conditions. Then look up the oil content for sorghum (Sorghum bicolor), and find out what the moisture content would be if sorghum was dried in the same way. Can you see a pattern emerging? Try out a few other seeds you are interested in, to see whether this pattern holds.
For many crops, you can combine this tool for calculating equilibrium moisture content with the tool for predicting viability. Go back to the ‘viability calculator’ of the Seed Information Database and look up Sorghum bicolor. The field for equilibrium moisture content is empty, but above it, there’s a button inviting you to perform a calculation. This takes you to the ‘equilibrium moisture content calculator’ tool that you have just explored. Select Sorghum bicolor from the long menu, and enter your genebank’s drying temperature and the relative humidity of the air in the drying room. When you go back to the viability calculator, there should now be a value in the ‘equilibrium moisture content’ field, enabling you to continue your prediction. What can you predict about sorghum’s viability after 1, 10 and 100 years?
Use the text box below to record what you have learned. These notes are for your own development: they will not be shared with course colleagues or moderators.
Drying seeds in genebanks
In module 3, you learned that international genebanks have devoted quite a lot of research to finding the best methods for drying seeds. You were introduced to the scientific evidence in favor of initially drying rice seeds at high temperature, before continue to dry according to the Genebank Standards. Here is a reminder of the evidence from trials at the International Rice Research Institute (IRRI) that you first saw in the section of module 3 entitled ‘Dried to perfection’.

These results suggest that for seeds that have not dried sufficiently on the parent plant, it is possible to obtain improvements in longevity – often by many percentage points. These improvements in longevity were enough to convince IRRI to make changes to their drying procedures.
The next video tells the story of the research behind those graphs, in the words of some of the scientists who were involved. Fiona Hay, one of the pioneering scientists conducting the first research at IRRI, discusses the initial investigation on rice. Olaniyi Oyatomi and Sola Owoborode take up the story of how these findings were rolled out to legume crops at IITA. You will see the two-stage drying system adopted by IRRI as a result of these investigations, and hear scientists talk about the benefits two-stage drying has brought. As you watch, think about how scientific investigations like this can translate into improvements in genebank procedures.
Transcript: Video 4: two stage drying
Use the box below to describe IRRI’s two-stage drying, and the scientific evidence on which they based their decision to change their practice. What parallels are there between findings at IRRI and findings at IITA? You should spend up to ten minutes on this. If your reflections on the video raise any questions, please post them on the Forum, where the course moderators will be able to help you.
When you are ready, press 'reveal' to see our comments.
Discussion
In IRRI’s two-stage drying, once seeds have been checked into the database, they are dried for the first few days at a temperature of around 30°C. Then they are moved into a second drying room, where they reach equilibrium at a lower temperature. The story of the research is interesting in itself, because it shows how a hypothesis made about one crop (rice) can then be tested in other crops (Bambara groundnut and soybean). Successful scientific investigations like this provide an evidence-base to support improvements to genebank procedures.
My genebank and me
For your next blog entry, think about how your own genebank manages water in seeds. What are the standard operating procedures? What could you do in your personal practice to make sure regenerated seeds remain as viable as they can be when they go into storage? If you would like to share your ideas with other participants and the moderators of the course, write a post in the Forum.
Technical tip
We recommend you open this in a new tab or window (right mouse click or long press) to enable you to easily return to this page.
The FAO’s Genebank Standards
In modules 3 and 4, you discovered evidence in favor of initially drying rice at high temperatures, such as 30°C. You learned how this is the result of the science of seed development and the science of water activity. You also learned that there could be potential improvements for other crops. However, this evidence is so recent that it is not currently included in the FAO’s Genebank Standards. Here’s a reminder of what they currently say about how seeds should be dried, and how they should be stored after drying.
- 4.2.1 All seed samples should be dried to equilibrium in a controlled environment of 5–20°C and 10-25 percent relative humidity, depending on species.
- 4.2.2 After drying, all seed samples need to be sealed in a suitable airtight container for long-term storage; in some instances where collections that need frequent access to seeds or likely to be depleted well before the predicted time for loss in viability, it is then possible to store seeds in non–airtight containers.
- 4.2.3 Most-original-samples and safety duplicate samples should be stored under long-term conditions (base collections) at a temperature of –18 ± 3°C and relative humidity of 15 ± 3 percent.
Discussion point: water activity in drying and storage
This is the fourth discussion point of the course.
In modules 3 and 4, we have discussed the importance of drying, and how it is affected by both the science of seed development and the science of water activity. In this two-part discussion, you will be advising a genebank manager about how to harness movements of water in and out of seeds, in order to make improvements to the way they process, dry and store those seeds. How can science help them to improve their results?
You should use these discussions to:
- Explore common dilemmas in seed quality management
- Listen to the opinions of other learners and the facilitator
- Come to a collective view on how to proceed when faced with this type of scenario in your own work
Press ‘Next’ to take part in both the discussions about this.
Discussion space 1: water activity and drying
What advice would you give a genebank manager who is thinking about changes they could make to their drying procedures, in order to improve longevity?
Discussion spaces:
As you move through the course, you may wish to return to the discussion spaces to add further posts or to read what other learners have posted.
You can access the discussion spaces from the main menu on the left-hand side of this page.
Discussion space 2: water activity and storage
The Genebank Standards suggest long-term storage at a relative humidity of 15 ± 3% RH. They also say that ideally, seeds should be stored in hermetically sealed packages. If the packages are hermetically sealed, does it matter what the relative humidity of the base store itself is? What advice would you give to the manager of a national genebank that does not have the facility to hermetically seal samples, but instead uses rubber-sealed jars?
Discussion spaces:
As you move through the course, you may wish to return to the discussion spaces to add further posts or to read what other learners have posted.
You can access the discussion spaces from the main menu on the left-hand side of this page.
Key words and concepts
Throughout this course, we offer you quizzes to help you keep track of how much you have learned. We hope you find them enjoyable. The quizzes within modules are not graded, and your results will not be shared with colleagues, but engaging with these quizzes is crucial to your success on this course. It is important to check your answers and read the feedback we have written: this feedback is often the best way to learn. It will help you to develop your own understanding.
Working through the quizzes in every module will build your confidence until by the end of the course, you will be ready to tackle the end-of-course quiz. Unlike the quizzes within modules, this final quiz will count towards your badge and statement of participation.
Have a go at this quiz, testing your understanding of key ideas in module 4.
The Forum
The Forum gives you the opportunity to meet course organizers and moderators and discuss what you have learned so far. It contains important information about your course, and enables you to talk to your colleagues about the ideas that emerge in the modules. It is therefore a good idea to get into the habit of going to the Forum regularly, and not just at the end of a module.
If you have any queries or reflections, there is a designated Q&A strand within the Forum, where you can post your questions. The course organizers will either answer on the Forum, or in the next live event.
Technical tip
We recommend you open this in a new tab or window (right mouse click or long press) to enable you to easily return to this page.
Live event
The second live event of the course is scheduled to correspond with this module. It will focus on the content of modules 3 and 4. Look out for emails from the course organizers about when this will happen. It is important to make sure that you get through all the online material for both modules 3 and module 4 before attending the live event.
Please use this space to reflect on the live event. These notes are for your own development and will not be shown to your moderators or colleagues. You will be able to download them at the end of the course.
Summary
You have reached the end of module 4. In this module, you have discovered how important water activity is for genebank processes. You have learned about the different forms water can take inside a seed, and how this influences seed viability. You have discovered different ways genebanks can measure and control the movement of water in and out of seeds, with a view to improving their longevity and viability. In the next section, module 5, you will shift your attention to the process of germination. What makes seeds germinate after they have been stored, and how can genebanks help encourage this?
Module 4 at a glance:
- Orthodox seeds can tolerate drying.
- The longevity and viability of orthodox seeds in storage are best when those seeds have been dried to equilibrium in a controlled environment.
- In dry seeds, water is bound tightly to large molecules: it is therefore less able to facilitate many types of biochemical reactions.
- In moist seeds, there is water freely circulating within the seed – this water is in a form that can facilitate the biochemical reactions that lead to germination.
- The conventional method of measuring moisture content of seeds (the gravimetric method) is destructive, expensive, and requires large samples.
- Measuring the equilibrium relative humidity (eRH) of seeds is a convenient and non-destructive alternative way to measure water activity in seeds.
- The eRH of seeds can be measured using a water activity meter.
Useful publications
If you were interested in some of the issues in this module, you might like to download and read these articles, which we have selected for you.
Hay, F. R., Rezaei, S., Wolkis, D. (2023). Determination and control of seed moisture. Seed Science and Technology, 51(2), pp. 267–285.
Available at: http://dx.doi.org/ 10.15258/ sst.2023.51.2.11.
Hay, F. R., Rezaei, S., Buitink, J. (2022). Seed moisture isotherms, sorption models and longevity. Frontiers in Plant Science, 13.
Available at: https://doi.org/ 10.3389/ fpls.2022.891913.
FAO (2014). Genebank Standards for Genetic Resources for Food and Agriculture. Rev. Ed. Rome.
Available at: https://www.fao.org/ 4/ i3704e/ i3704e.pdf.
FAO (2022). Practical guide for the application of the Genebank Standards for Plant Genetic Resources for Food and Agriculture: conservation in seed genebanks. Commission on Genetic Resources for Food and Agriculture, Rome.
Available at: https://doi.org/ 10.4060/ cc0021en.
Labuza, T., Tannenbaum, S., Karel, M. (1970). Water content and stability of low moisture and intermediate moisture foods. Journal of Food Technology, 24: pp 543-550.
Available at: https://www.scienceopen.com/ document?vid=24780f89-982f-4044-adcb-fbeae747a9f9.
Whitehouse, K. J., Hay, F. R, Ellis, R. H. (2015). Increases in the longevity of desiccation-phase developing rice seeds: response to high-temperature drying depends on harvest moisture content. Annals of Botany, 116(2): pp. 247–259.
Available at: https://doi.org/ 10.1093/ aob/ mcv091.