Use 'Print preview' to check the number of pages and printer settings.
Print functionality varies between browsers.
Printable page generated Wednesday, 1 July 2026, 6:22 PM
Antenatal Care Module: 1. Planning Antenatal Care
Study Session 1 Planning Antenatal Care
Introduction
In this study session you will learn about the status of maternal and newborn mortality worldwide, in Africa as a whole, and in Ethiopia specifically, so you can understand the extent of the problems that need to be addressed through improved maternal and newborn health services. Antenatal care, the professional healthcare a woman receives throughout her pregnancy, is important in helping to ensure that women and newborn babies survive pregnancy and childbirth. We show you how to plan the antenatal care services that your community needs in order to improve and protect the health of mothers and newborns during pregnancy, childbirth and the postnatal period. You will learn what is meant by the antenatal profile of your community, and how to calculate the number of mothers who are pregnant every year in your catchment area. They will need antenatal care throughout pregnancy, and your expert support during labour, delivery and the postnatal period. You will also be collecting and reporting data on how many antenatal visits each woman receives, and what proportion of births were attended by a health professional.
Learning Outcomes for Study Session 1
When you have studied this session, you should be able to:
1.1 Define and use correctly all of the key words printed in bold. (SAQs 1.1, 1.2 and 1.4)
1.2 Compare the extent of maternal and newborn deaths and complications in Ethiopia with the situation globally and in Africa as a whole. (SAQ 1.1)
1.3 Know how to estimate the number of pregnant women who will need antenatal care in your community in one year. (SAQ 1.2)
1.4 Know how to develop a focused antenatal care plan of four visits to each pregnant woman during a specific period of time in your catchment area. (SAQ 1.3)
1.5 Know how to calculate the antenatal care coverage rate, and the proportion of births attended by a health professional, in your catchment area. (SAQ 1.2)
1.6 Know how to calculate the maternal mortality ratio (MMR) and the neonatal mortality rate in your catchment area. (SAQ 1.4)
1.1 Maternal and newborn mortality
We begin this study session by describing how many mothers and newborns die as a result of complications of pregnancy or childbirth around the world. The World Health Organization (WHO) set Millennium Development Goals (MDGs) in the year 2000 (1992 in the Ethiopian calendar) to reduce maternal mortality in every country by three-quarters, and the mortality of children under 5 years by two-thirds by the year 2015 (2007 in the Ethiopian calendar). Ethiopia is one of the few countries in the world that is expected to achieve the MDGs for reducing maternal and child deaths. Your role as a health professional is vital in attaining these goals.
All dates in the rest of this Module use the European/US calendar.
1.1.1 Maternal deaths and complications
A maternal death (also known as a maternal mortality) is defined as the death of a woman while pregnant or within 42 days of termination of pregnancy, irrespective of the duration (length) and the site of pregnancy, from any cause related to, or aggravated by, the pregnancy or its management, but not from accidental or incidental causes (i.e. causes of death not related to the pregnancy). The five major causes of maternal mortality are:

- unsafe abortion
- eclampsia (caused by dangerously high blood pressure during the pregnancy)
- obstructed labour
- postpartum haemorrhage (bleeding after childbirth)
- puerperal sepsis (bloodstream infection after childbirth).
You will learn about each of these causes in detail in later study sessions in this Module. Here we are focusing on how data on maternal deaths are collected and reported, so you can estimate the maternal mortality in your catchment area.
Every year the WHO estimates that worldwide around 536,000 women die from complications of pregnancy and childbirth, and that 99% of them are in developing countries. At least 7 million women who survive childbirth suffer serious long-term health problems, and a further 50 million women suffer some adverse health consequences after childbirth. The overwhelming majority of these complications occur in developing countries (WHO Report on Progress Towards Achieving the Millennium Development Goals, published 2009).
Each year in Africa, 30 million women become pregnant, and 18 million give birth at home without skilled care from a trained health professional. As a consequence, every year over 250,000 African women die because of complications related to pregnancy and childbirth, and four million African women have non-fatal complications of pregnancy (Save the Children, USAID, UNFPA, UNICEF, WHO, Opportunities for Africa’s Newborns: Practical Data, Policy and Programmatic Support for Newborn Care in Africa, 2006).
What proportion of the worldwide number of maternal deaths occurs in Africa?
African women account for almost half of the 536,000 women who die every year as a consequence of complications of pregnancy or childbirth.
Maternal mortality ratios (MMRs)
The best way of comparing the extent of maternal deaths in different parts of the world is to calculate the maternal mortality ratio (MMR), which tells you the number of maternal deaths that occur in every 100,000 live births. The MMR is internationally recognised as one of the most important indicators of maternal health and the quality of antenatal, delivery and postnatal care in a country. Later in this study session, we will show you how to calculate the maternal mortality ratio in your catchment area.
The Ethiopian Demographic and Health Surveys (EDHS) of 2000 and 2005 have produced estimates of the maternal mortality ratio for the country as a whole. In 2000, for every 100,000 live births in Ethiopia, 871 mothers died because of complications of pregnancy or childbirth. By 2005, this number had fallen to 673 per 100,000 live births — well below the average of 900 per 100,000 live births for Africa as a whole, but still one of the highest in the world. In 2008, the global average MMR was 400 maternal deaths per 100,000 live births, and the European average was only 27 per 100,000 live births.
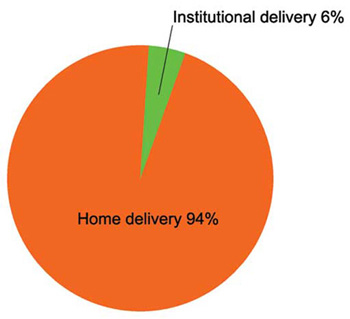
In Ethiopia in 2005, an estimated 3,119,000 million women gave birth. Figure 1.1 shows that 94% of these births occurred at home — mostly in rural communities like yours (EDHS, 2005).
Calculate the number of maternal mortalities in Ethiopia in 2005, based on the MMR for that year.
The MMR in 2005 = 673 per 100,000 live births and there were 3,119,000 total births that year. 3,119,000 divided by 100,000 = 31.19. So, in the country as a whole, 31.19 × 673 = 20,991 women died as a consequence of complications of pregnancy or childbirth.
Although MMRs give public health policy makers a measurement of the magnitude of the problem of maternal deaths, they cannot inform us about what interventions are needed to save women’s lives. Studying this Blended Learning Module and the next two, which are on Labour and Delivery Care and Postnatal Care, together with the associated practical training for these Modules, will enable you to reduce maternal mortalities in your community.
1.1.2 Newborn deaths and complications
A neonatal death (also known as a newborn death) is defined as a death in the first four weeks of life of a baby who was born alive. Globally, about 3 million newborn deaths occur in the first four weeks of life and there are also 3 million stillbirths. A stillbirth is defined as the delivery of a dead baby after the 24th week of pregnancy. Before 24 weeks the loss of the fetus is usually referred to as a miscarriage.
Africa accounts for 11% of the world’s population, but more than 25% of the world’s newborn deaths. Of the 20 countries in the world with the highest risk of neonatal death, 15 of them (75% of the total) are in Africa. Approximately one million African babies are stillborn, of whom at least 300,000 die during labour. A further 1.16 million African babies die in their first four weeks of life, with up to half of these on the first day — and another 3.3 million will die before they reach their fifth birthday. Four million low birth weight babies, and others with neonatal complications survive, but may not reach their full potential (Save the Children, USAID, UNFPA, UNICEF, WHO. Opportunities for Africa’s Newborns: Practical Data, Policy and Programmatic Support for Newborn Care in Africa, 2006).
Neonatal mortality rates
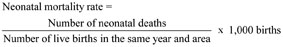
The neonatal mortality rate is the number of deaths in the first four weeks (28 days) of life for every 1,000 babies born alive. This rate is usually referred to as ‘neonatal deaths per 1,000 live births’. Neonatal mortality rates have also been calculated by the EDHS. In 2005, the rate was 39 deaths per 1,000 live births. Ethiopia is one of five countries that contribute to half of Africa’s newborn deaths. The primary causes of these deaths are infection, asphyxia and preterm birth. Later in this study session, we will show you how to calculate the neonatal mortality rate in your catchment area.
1.1.3 How can maternal and neonatal mortalities be reduced?

The reduction of maternal and neonatal mortality has been globally recognised as one of the World Health Organization’s Millennium Development Goals (MDGs), set in the year 2000. By improving maternal health and nutrition during pregnancy through effective antenatal care, ensuring safe and clean delivery, and providing immediate postnatal care, it is estimated we could prevent about 75% of neonatal deaths, more than 50% of deaths in the first year of life, and 99% of maternal deaths. These improvements can be achieved by effective community level interventions, which include effective communication and health education about antenatal care (covered in Study Session 2), the early detection and management of health problems during pregnancy (covered in later study sessions in this Module), and about care during labour, delivery and the postnatal period, and the management of newborn and childhood illness (in the next three Modules).
1.2 Planning for maternal and newborn healthcare in your community
Pregnant women may face many different health problems during pregnancy. Some of these are bleeding, high blood pressure, convulsions, high fever, blurred vision, abdominal pain, breathing difficulties, severe headache, anaemia, diabetes and infections. You will learn about the diagnosis and management of all these health problems in later study sessions in this Module.
To ensure a full understanding of the problems that pregnant women may face during the antenatal period, and the possible solutions, a well planned antenatal care programme is necessary. The content of the programme and the method of approach should be based on the presentation of clear educational messages (as you will see in Study Session 2).
To plan effective maternal and newborn health services, you need to make an assessment of your community and identify the health needs of the population.
How could you do this?
You can carry out this assessment through asking questions or through discussion with community representatives and elderly people who know the persistent patterns of habits, customs, attitudes and values in the community, which are transmitted from generation to generation.
Then you need to identify the problems in relation to maternal and newborn health conditions, and assess the uptake of services. In promotion of maternal and child health services, you should clearly identify any attitudes and conditions which have an influence on the outcomes. For example, in small villages, when a woman has a problem in labour it is very difficult for her to go to a health centre or hospital. Few or no villagers have cars, and even in urban areas most taxi drivers refuse to take a woman in labour to hospital. It is therefore very important for you to have an emergency care plan set up, and to make arrangements for transporting women who need urgent care to treat complications associated with pregnancy or childbirth. You will learn about emergency care planning in Study Session 13.
Finding out what the concerns are in your community is an important first step in identifying and studying the problems in your catchment area, and your next step is to rank them in priority order.
1.2.1 Ranking and prioritising problems to tackle
You should rank the identified problems based on the following criteria:
- Magnitude or extent of the problem (how big is this problem?)
- Severity of the problem (how serious is it in terms of adverse outcomes?)
- Feasibility or practicability (how easy or difficult would it be to tackle this problem?)
- Community concern (is this problem an important concern for the community?)
- Government concern (is it an important concern for the government?).
For example, if there is low antenatal care (ANC) coverage and low latrine coverage in your catchment area, you might set the priority of these two problems, as shown in Table 1.1. The scoring system is from 1 to 5, where 1 is the lowest ranking and 5 is the highest. You decide on the score in each box in the table, based on your knowledge of your community and its needs.
| Identified problem | Magnitude | Severity | Feasibility | Community concern | Government concern | Total (out of 25) |
|---|---|---|---|---|---|---|
| Low ANC coverage | 5 | 5 | 5 | 5 | 5 | 25 |
| Low latrine coverage | 5 | 4 | 4 | 4 | 4 | 21 |
As you can see in Table 1.1, the total score is 25 for low ANC coverage and 21 for low latrine coverage. So, in this example, you would set low ANC coverage as a higher priority problem. When you have identified a high priority problem to tackle in your community, your next steps are listed in Box 1.1.
Box 1.1 Steps in tackling a problem
- Set the objectives (e.g. increase the number of women receiving antenatal care visits)
- Identify the strategies you will use to achieve this (e.g. by organising a health education campaign to promote the benefits of antenatal care — as described in Study Session 2)
- Locate the resources needed for implementation of your plan
- Set the time span for reaching your target
- Continuously monitor and evaluate your progress towards achieving your goals.
1.2.2 Calculating the number of women who need antenatal care services
The first step in assessing the need for antenatal care in your community is to calculate the number of women who are likely to be pregnant in a normal year. These women are sometimes referred to as the antenatal eligibles (because they are ‘eligible’ to receive antenatal care).
A community profile describes the size and characteristics of a community, and the main health factors that affect its population. Population statistics, including facts and figures about maternal health and pregnancy in the community and information about how the community functions, are important information for planning and promoting effective antenatal care. But remember that every community is different, so the examples we give in this section may not be the same as you will find in your community.
According to the population statistics for Ethiopia, the number of pregnant women is calculated as 4% of the general population. This percentage will vary to some extent between communities, depending on the number of women of childbearing age in the population. The number of women who are eligible for antenatal care in one year in Ethiopia can be estimated with reasonable accuracy using the 4% figure.
Activity 1.1 Calculating the antenatal eligibles in a community
Imagine that the total number of people in one community is exactly 5,000. Calculate how many pregnant women are likely to be eligible for antenatal care services in this community in one year.
Answer
The total number of pregnant women is calculated as 4% of the 5,000 population. To calculate 4% of 5,000, you multiply 5,000 by 4 and divide the result by 100. A good way to write this down is as follows:
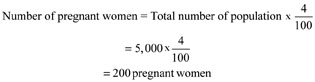
Therefore, this community is expected to have 200 pregnant women in one year, who are eligible for antenatal care, delivery and postnatal care. If you know the number of people in your own community, use the 4% figure to calculate the number of pregnant women who will need your services in one year. Write your calculation in your Study Diary and show it to your Tutor at the next Study Support Meeting.
1.2.3 Calculating the number of focused antenatal care check-ups
Women who have good antenatal care during pregnancy are more likely to have safer births and healthier babies. A more efficient and effective approach to providing antenatal care has been developed in recent years. This new approach is called focused antenatal care (FANC). It is a four visit schedule which is recommended for a pregnant woman without major health problems. The schedule of the four focused antenatal visits is as follows:
| A | B |
|---|---|
| First visit | Beyond 16 weeks of pregnancy |
| Second visit | Between 24 and 28 weeks |
| Third visit | Between 30 and 32 weeks |
| Fourth visit | Between 36 and 40 weeks. |
You will learn what to do at each of these focused antenatal check-ups in detail in Study Session 13.
Look back at the answer to Activity 1.1. In that community, how many antenatal visits would you make in one year if you achieved focused antenatal care for every pregnant woman?
You would make 800 antenatal visits (4 visits to each of the 200 pregnant women).
This calculation illustrates how carefully you will need to plan your antenatal care service, if you are going to visit each pregnant woman four times! If you cannot achieve this total, you should visit every pregnant woman at least once, and record the visit as described in the next section.
1.2.4 Calculating the uptake of antenatal care services
Antenatal care coverage is defined as the proportion of pregnant women attended at least once during the current pregnancy by a health professional such as a Health Extension Practitioner, for reasons related to the pregnancy. Calculating the antenatal care ‘first visit’ coverage provides information on the percentage of women who use antenatal care services.
The antenatal care coverage rate (or ANC coverage rate) is calculated as the total number of pregnant women attended at least once during their pregnancy by a health professional for reasons relating to the pregnancy, divided by the total number of expected pregnancies during a given time period (usually one year) in the catchment area. The result is expressed as a percentage by multiplying by 100.

For example, if the total number of first antenatal visits = 100, and the total number of pregnancies = 200, then the antenatal care coverage in your community will be 50%, calculated as written below:

Why do you think the calculation of the antenatal care coverage rate in your community is important?
It enables you and your supervisor to see whether your efforts to promote the uptake of antenatal care services are successful. For example, if the antenatal care coverage rate was 50% of pregnant women before you began a health promotion campaign to increase uptake of antenatal care services, you could claim your campaign was successful if the uptake rose to 60% or more.
1.2.5 Calculating the proportion of births attended by health professionals
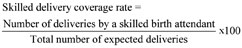
Similarly, successful planning of labour and delivery care services can be evaluated by calculating the percentage of deliveries attended by a health professional, divided by the total number of expected deliveries occurring during a given time period (usually one year) in the catchment area (× 100).
According to the Ethiopian Demographic and Health Survey 2005, only 6% of births in Ethiopia were attended by a skilled birth attendant — a person who has been trained in midwifery skills to the level of proficiency necessary to manage normal deliveries and diagnose, manage or refer obstetric complications. She or he must be able to recognise the onset of complications, perform certain essential interventions, start treatment, and supervise the referral of mother and baby for interventions that are beyond their competence, or not possible in their particular setting. Ethiopia has the lowest skilled delivery coverage rate in the world. The percentage of deliveries attended by a skilled birth attendant is calculated as follows:
Calculate the skilled delivery coverage rate if you attended 150 out of 200 births in your catchment area.
It would be 150/200 × 100 = 75%
Achieving a high delivery coverage rate will help you to reduce maternal and neonatal deaths and complications in your community. In the next two sections, we show you how to calculate these death rates.
1.2.6 Calculating the maternal mortality ratio
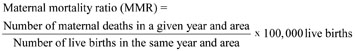
The maternal mortality ratio (MMR) is defined as the number of maternal deaths in a given year, in a particular area (which can be a whole country, or a region, or a community such as your community), divided by the number of live births in the same year and area. The result is multiplied by 100,000 live births, so that comparisons can be made with other years and other areas.
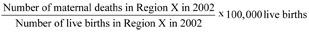
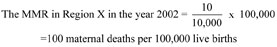
In Region X in 2002, there were 10 maternal deaths and 10,000 live births. What was the maternal mortality ratio in Region X per 100,000 live births in that year?
How does this MMR compare with the MMR for Ethiopia in 2005?
It is very low by comparison with the Ethiopian MMR of 673 maternal deaths per 100,000 live births in that year. If this MMR was achieved across Ethiopia, the Millennium Development Goal of reducing maternal mortality by three-quarters by 2015 would be more than successfully met.
1.2.7 Calculating the neonatal mortality rate
By now, you should be able to work out how to calculate the neonatal mortality rate in your catchment area. Remember that this rate is expressed per 1,000 live births.
In conclusion, this study session has shown you how to plan the number of visits in your antenatal care service, and how to estimate your success every year by calculating how much you have increased the antenatal care coverage and delivery coverage rates, and reduced the maternal mortality ratio and the neonatal mortality rate in your catchment area. In Study Session 2, we show you some effective methods of promoting good antenatal care in your community through health education, advocacy and social mobilisation.
Summary of Study Session 1
In Study Session 1, you have learned that:
- Every year worldwide, around half a million women die from complications of pregnancy and childbirth, at least 7 million suffer serious long-term health problems, and a further 50 million suffer some adverse consequences. The overwhelming majority of these deaths and complications occur in developing countries, particularly in Africa.
- Globally, about 3 million newborn babies die in the first four weeks of life and there are also 3 million stillbirths. Africa accounts for 11% of the world’s population, but 25% of all newborn deaths.
- The maternal mortality ratio (MMR) in Ethiopia in 2005 was 673 per 100,000 live births. The neonatal mortality rate in that year was 39 deaths per 1,000 live births.
- The World Health Organization’s Millennium Development Goals (MDGs), set in the year 2000, have set targets to reduce child mortality by two-thirds, and maternal mortality by three-quarters, by 2015.
- Large reductions can be achieved through effective community level communication and health education, and well-planned antenatal, labour, delivery and postnatal care services, and the integrated management of newborn and childhood illness.
- Assessment of your community, and identification of the health needs of the population, can be carried out through asking questions or through discussion with community representatives and elderly people.
- You can estimate the number of women who are eligible for antenatal care in one year in your catchment area with reasonable accuracy by calculating 4% of the general population of the area.
- You can calculate your antenatal care coverage rate from the total number of pregnant women you attended at least once for reasons relating to their pregnancy, divided by the total number of expected pregnancies in your catchment area in one year (× 100%).
- You can estimate your delivery coverage rate by calculating the proportion of deliveries you attended, divided by the total number of expected deliveries in your catchment area in one year (× 100%).
- One way to estimate the effectiveness of your antenatal and delivery care services is to calculate the maternal mortality ratio (MMR) per 100,000 live births, and the neonatal mortality rate per 1,000 live births in your area, to see if they are reducing every year.
Self-Assessment Questions (SAQs) for Study Session 1
Now that you have completed this study session, you can assess how well you have achieved its Learning Outcomes by answering these questions. Write your answers in your Study Diary and discuss them with your Tutor at the next Study Support Meeting. You can check your answers with the Notes on the Self-Assessment Questions at the end of this Module.
SAQ 1.1 (tests Learning Outcome 1.2)
How does the MMR for Ethiopia in 2005 compare with the MMR for Africa, and the world figure? Justify your choice from the list below.
A It is above the average figure for Africa, and above the average figure for the world.
B It is below the average figure for Africa, and below the average figure for the world.
C It is above the average figure for Africa, and below the average figure for the world.
D It is below the average figure for Africa, and above the average figure for the world.
Answer
D is the correct answer. By 2005, the MMR for Ethiopia was 673 per 100,000 live births — well below the average of 900 per 100,000 live births for Africa as a whole, but still one of the highest in the world. In 2008, the global average MMR was 400 maternal deaths per 100,000 live births.
SAQ 1.2 (tests Learning Outcomes 1.1, 1.3 and 1.5)
Imagine that the total number of people in a catchment area is 10,000, and the total number of first antenatal visits the Health Extension Practitioners (HEPs) made last year was 150.
a.Calculate the number of pregnant women who were eligible for antenatal care services in this catchment area last year.
b.What was the antenatal care coverage rate achieved by the Health Extension Practitioners last year?
Answer
a.The total number of pregnant women in this catchment area is calculated as 4% of the 10,000 population. To calculate 4% of 10,000, you multiply 10,000 by 4 and divide the result by 100. This is as follows:
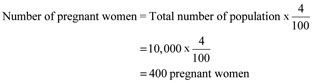
Therefore, this community is expected to have 400 pregnant women in one year, who are eligible for antenatal care, delivery and postnatal care.
b.You calculate the ANC coverage rate as the total number of pregnant women attended at least once during their pregnancy by the Health Extension Practitioners for reasons relating to the pregnancy, divided by the total number of expected pregnancies in the same year. The result is expressed as a percentage by multiplying by 100. You can calculate it as:
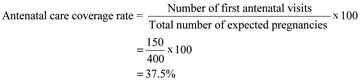
Only 37.5% of the pregnant women in this catchment area received one antenatal visit. These Health Extension Practitioners need to improve the antenatal care coverage rate in their kebele!
SAQ 1.3 (tests Learning Outcome 1.4)
Assume that the total population of a community is 8,000. How many antenatal visits would the Health Extension Practitioners make in one year if they achieved focused antenatal care for every pregnant woman?
Answer
First calculate the expected total number of pregnant women in the 8,000 population in the community, as shown below:
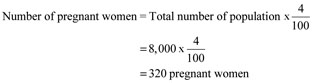
Therefore, this community is expected to have 320 pregnant women in one year, who are eligible for antenatal care, delivery and postnatal care. Then calculate the number of antenatal visits the Health Extension Practitioners would make in one year if they achieved the focused antenatal care coverage rate of 4 visits for every pregnant woman.
320 x 4 = a total of 1,280 antenatal visits.
SAQ 1.4 (tests Learning Outcomes 1.1 and 1.6)
Assume that there were 480 maternal deaths, 960 neonatal deaths and 60,000 live births in Region Y in the year 2005.
- a.Calculate the MMR and the neonatal mortality rate in this region in that year.
- b.Was Region Y doing better or worse than the national average for maternal and neonatal mortalities in Ethiopia in 2005? Justify your conclusions.
Answer
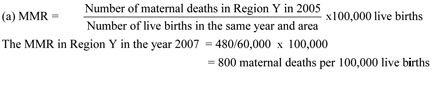

(b) Maternal mortality in Region Y was 800 maternal deaths per 100,000 live births, which is worse than the Ethiopian national average of 673 per 100,000 live births in 2005. It was doing better than the national average for neonatal deaths in 2005 – 16 newborns died in every 1000 live births, compared to 39 per 1000 nationally.