Use 'Print preview' to check the number of pages and printer settings.
Print functionality varies between browsers.
Printable page generated Thursday, 22 January 2026, 2:28 AM
Immunization Module: Monitoring your Immunization Programme
Study Session 10 Monitoring your Immunization Programme
Introduction
In this study session you will learn about how to monitor your own immunization programme. Monitoring is the routine ongoing collection of data and the assessment of activities, in order to enable the targets you agreed in your action plan to be compared with what you have actually achieved. Monitoring an immunization programme includes the proper use of EPI recording tools to collect reliable data, which can be evaluated to improve the planning and management of the immunization service in the future. So, in this study session, we will teach you about the main recording tools used to collect and report the data from your immunization programme, so you can monitor and evaluate your performance.
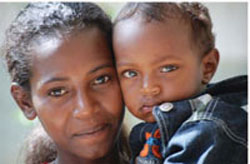
The aim of this study session is to teach you how to improve your immunization service by identifying problems and their causes, developing solutions, and incorporating these solutions as activities in your work plan. Your overall goal is to increase immunization coverage rates and reduce dropout, so that babies like the one pictured in Figure 10.1 can be protected from all the vaccine-preventable diseases covered by the EPI.

Learning Outcomes for Study Session 10
- 10.1 Define and use correctly all of the key words printed in bold. (SAQs 10.1 to 10.5)
- 10.2 Describe how to use the basic EPI recording tools: immunization cards, the EPI Registration Book and the tally sheet. (SAQ 10.1)
- 10.3 Explain how you calculate immunization coverage and dropout rates and use them to monitor the success of your immunization programme. (SAQs 10.2, 10.3 and 10.4)
- 10.4 Explain the possible causes of low immunization coverage rates, and/or high dropout rates, and suggest ways to improve these EPI indicators, including systems for tracing defaulters. (SAQs 10.3 and 10.4)
- 10.5 Describe how you make accurate, timely and complete immunization Summary Reports from your Health Post. (SAQ 10.5)
10.1 EPI recording tools
We begin by teaching you about the basic EPI recording tools used in immunization programmes: these are the infant immunization card, the EPI Registration Book, the tally sheet and the Summary Report Form. Already described in earlier study sessions are the Vaccine Stock Register and Family Folder, which are not covered again here.
10.1.1 Infant immunization card
The infant immunization card (or vaccination card) is a small card that contains relevant information about the child and his or her immunization history. It is kept by the mother or other principle caregiver of the infant. It shows:
- a unique identification number (card number)
- name of the infant
- its birth date
- its sex
- name and address of mother/parent
- date that infant was protected at birth (PAB) from neonatal tetanus
- date of each subsequent immunization and vitamin A supplement given
- date when the next immunization is due.
The cards may vary slightly, and some may show additional information, such as the age of the mother and dates of her TT immunizations (Figure 10.2).
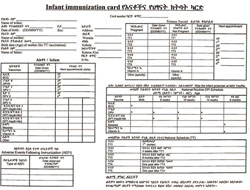
We now consider how you should complete the infant immunization card. You should write down the date for each vaccine administered, or vitamin A supplement given. Include doses of TT given to the mother if she is eligible for a dose. Mark the next appointment date on the card and tell the mother when and where to return for the next dose of the vaccine. Make sure that the appointment date corresponds to a planned immunization session. Remind the mother verbally as well as by writing on the card. Always return the card to the mother or caregiver.
10.1.2 The EPI Registration Book
The EPI Registration Book (or Immunization Register) is a book for entering immunization data. It helps you keep a record of the immunization services you offer to each infant and to women of childbearing age, particularly all those who are pregnant (Figure 10.3). Your Health Post can either have two separate EPI Registration Books, one for recording infant immunizations and another for recording TT given to women, or one book to record both. The Immunization Register can also be used like a birth register. As soon as an infant is born in the community, its name can be entered in the register even before the infant has received any immunizations. This will help you to follow up all infants in the community.

What information is entered in the Registration Book?
The EPI Registration Book should include the following information:
- a unique identification number (registration number)
- registration date (usually the date of the first visit)
- full name of infant
- infant’s birth date
- infant’s sex
- immunizations (vaccine lot number and dose) and vitamin A supplements given
- whether the infant was protected at birth (PAB) from neonatal tetanus
- additional remarks (e.g. growth monitoring).
The following information about TT doses given to women may be recorded in a separate book, or in your EPI Registration Book:
- name and address of mother
- TT immunization provided to pregnant and non-pregnant women in the target age group (15–49 years) by dose.
Using the Registration Book
You must register infants, and women in the 15–49 age group (whether they are pregnant or not), as soon as they arrive at the Health Post or outreach site. Fill in all the required information, except the space provided for immunizations, which should only be completed after the immunization has actually been given. It is important to enter a unique registration number for each infant, which is the same number as the one on the immunization card. This way, for the next immunization, it will be easy to locate the infant’s entry in the Registration Book.
Do not create a new entry in the register each time the mother brings the infant for immunization. Ask the mother for the immunization card and look for a corresponding entry in the register. If the immunization card is not available, ask the mother the age of her infant and details of the first immunization to help you locate the infant’s entry in the Registration Book.
For every new infant who has never been immunized, create a new entry in the register and complete a new immunization card. For an infant who has come to your Health Post for the first time, but has received immunizations in another health facility, create a new entry in the register, ask for the immunization card and mark on the register the immunizations that the infant has already received.
Remember to record the vaccine dose and lot number in your Vaccine Stock Register (see Study Session 5).
10.1.3 Immunization tally sheets
Tally sheets are forms on which health workers make a mark every time they administer a dose of vaccine. These are used as the basis for monitoring and making regular summary reports of vaccine use. Use a new tally sheet for each immunization session (Figure 10.4). The same tally sheet can be used to mark vaccines given to infants, and vaccines given to pregnant and non-pregnant women in the childbearing age group.
After you have immunized an infant, record the immunization in the EPI Registration Book and on the infant’s immunization card, and inform the mother which doses were given. On the tally sheet, place a mark next to the dose you have just given. Mark each vaccine dose given on the tally sheet immediately after giving it.
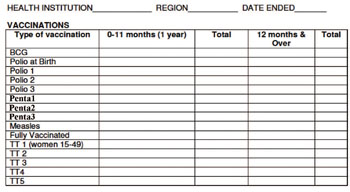
After immunizing any woman, whether she is pregnant or not, record the immunization in the EPI Registration Book and on the woman’s immunization card, and mark it in the correct column of the tally sheet and the Vaccine Stock Register. If no card is available, rely on the woman’s history to tally the dose. For example, if a woman says she has received three doses in the past, tally the new dose as TT4, issue a new card for the woman and mark the card with the date.
Check that the tally sheet is complete at the end of a session. Add up the number of doses of each vaccine that you have given during the session, and check that the number of doses given ‘tallies’ (matches) the number recorded in your EPI Registration Book. You will use this information to monitor your performance and to prepare your monthly Summary Report (described in Section 10.6) to your supervisor and the woreda health office. Keep the tally sheets so that your supervisor can check the data quality (accuracy of reporting).
Common mistakes during tallying
The common mistakes that can occur on tally sheets are summarized in Table 10.1.
| Possible mistake | Possible problem that may occur | Correct practice |
|---|---|---|
| Tallying before the vaccine is administered | The child or woman may not receive the vaccine | Give the dose first, then mark on the tally sheet |
| Tallying at the end of a session according to the number of doses remaining in the opened vials | ‘Wasted’ doses may be counted as being given | Tally each dose as it is given |
| Tallying all vaccines under one age group (including those outside the targeted age) | Inaccurate immunization coverage data | Tally separately for infants under one year and those over one year old |
10.2 Monitoring EPI indicators
For immunization to be effective in reducing cases of vaccine-preventable diseases and deaths, every child should be fully immunized by the age of one year. A [Sometimes you will see this statistic referred to as ‘fully immunized infant’ (FII).] fully immunized child (FIC) has received all doses of all EPI vaccines, including measles vaccine, before the age of one year. In this section, we show you the two main ways to monitor whether your immunization service has the potential to reduce the target EPI vaccine-preventable diseases. You do this by measuring the:
- immunization coverage rate for each vaccine
- dropout rates from completion of scheduled immunizations.
These are the two main EPI indicators that are used internationally to analyse the performance of EPI programmes.
10.2.1 How to measure immunization coverage rates
Immunization coverage is the percentage of eligible fully-immunized infants compared to the total number of surviving infants in the target population. The immunization coverage rate is measured by comparing the number of doses actually given and the number in the target population of surviving infants under one year of age (these are the eligible infants). The result is expressed as a percentage. The equation below shows you how to calculate immunization coverage rate in your kebele.
Immunization coverage rate (for a particular vaccine) =
number receiving all doses ÷ number in the target population x 100%, where:
- number receiving all doses is the number of surviving infants under one year of age receiving all the required doses during the previous 12 months for the selected vaccine.
- target population is the total number of eligible infants under one year of age (or total number of surviving infants) at the start of that reporting period.
If the total number of fully immunized infants aged under one year in a particular kebele was 192 during the annual reporting period, and the total number of eligible infants in this age group was 205, what was the immunization coverage rate in that period?
The calculation is (192 ÷ 205) x 100% = 93.6%. In other words, in this example, 93.6% of the eligible infants were fully immunized during that reporting period.
If the number of fully immunized infants appears to be greater than the number in the target population, this indicates that some of the recorded information must be incorrect. The reason for this problem should be identified.
Can you suggest some possible reasons for this problem with the coverage data?
The target population data may be incorrect; there could have been more surviving infants aged under one year than the number counted. The number of fully immunized infants recorded may include some children aged over one year. Children from other areas (not counted in your target population) may have come to your Health Post for immunization.
10.2.2 How to measure dropout rates
The dropout rate is found by comparing the number of infants who start the immunization schedule with the number who complete it. Two measures of dropout rate are routinely used:
In this section, we refer to pentavalent vaccine, which is also known as DPT-HepB-Hib vaccine.
- the dropout rate between infants receiving the first dose of pentavalent vaccine (Penta1) and the third dose (Penta3)
- the dropout rate between receiving the first dose of pentavalent vaccine (Penta1) and the single dose of measles vaccine.
Pentavalent 1 to pentavalent 3 dropout rate
What should the interval be between receiving pentavalent 1 and pentavalent 3 vaccines?
The interval should be 8 weeks: pentavalent 1 is given at 6 weeks of age, and pentavalent 3 is given at 14 weeks.
If an infant fails to complete the schedule of three doses of pentavalent vaccine, it indicates that there is an access problem for the parents, i.e. they have difficulty in getting to (accessing) the immunization sessions for the second or third doses.
The pentavalent 1 to pentavalent 3 dropout rate is calculated using the following equation:
Brackets in an equation mean that you should calculate the answer to whatever is inside the brackets first.
Penta1 to Penta3 dropout rate = (Penta1 – Penta3) ÷ Penta1 x 100%, where:
- Penta1 is the number (or percentage) receiving the first pentavalent vaccine dose
- Penta3 is the number (or percentage) receiving the third dose.
Imagine that 156 infants received the first dose of pentavalent vaccine at your Health Post last year. The number brought back for the second dose was 140 and the number who received the third dose was 132. What was the Penta1 to Penta3 dropout rate for your Health Post last year?
In this example, Penta1 is 156 and Penta3 is 132.
So the Penta1 to Penta3 dropout rate in this example is:
(156 – 132) ÷ 156 x 100%, or
24 ÷ 156 x 100% = 15.4%.
Another way of analysing dropout rates is to start with the percentage of the target population that attends for pentavalent 1, and compare this with the percentage that attends for pentavalent 3. For example, imagine that 70% of the eligible infants in a kebele are brought to you for pentavalent 1 immunization. However, you find that only 61% of the target population complete the three-dose series of pentavalent vaccine.
What is the Penta1 to Penta3 dropout rate in the above example?
Penta1 is 70% and Penta3 is 61%.
So the Penta1 to Penta3 dropout rate = (70 – 61) ÷ 70 x 100%, or
9 ÷ 70 x 100% = 12.8%
Pentavalent 1 to measles vaccine dropout rate
There is a very long interval in the EPI schedule in Ethiopia between an infant receiving the first pentavalent immunization at six weeks old, and completing the ‘fully immunized’ schedule with the single dose of measles vaccine at 9 months of age (Figure 10.5). It is very important to complete all the immunizations in order to protect children from all the EPI target diseases.
The pentavalent 1 to measles vaccine dropout rate is calculated using the following equation:
- Penta1 to measles vaccine dropout rate = (Penta1 – measles) ÷ Penta1 x 100%, where:
- Penta1 is the number (or percentage) of infants receiving the first pentavalent 1 dose
- measles is the number (or percentage) of infants receiving the measles vaccine.
If there is a high dropout rate between Penta1 and the measles immunization, it suggests that there is a problem for parents of utilising (making use of) the health services generally. A dropout rate of more than 10% indicates that the particular Health Post has a utilisation problem — i.e. many people are not using the services on offer.
10.2.3 Calculating the number of un-immunized infants
You should also calculate the annual number of un-immunized infants — i.e. eligible infants who have not completed any of the scheduled immunizations. You do this using the following equation:
- number of un-immunized infants = target population – fully-immunized infants, where:
- target population is the total number of eligible infants in the target age-group for immunization (under one year)
- fully-immunized infants is the number in the target age-group who have received all doses of all the EPI vaccines.
10.3 Analysing and interpreting immunization data
After determining the immunization coverage and dropout rates, you need to analyse and interpret the data in relation to your planned targets.
10.3.1 What data should you analyse?
You should analyse your data in terms of the categories listed in Box 10.1 for each reporting period (monthly or quarterly).
Box 10.1 Data analysis to evaluate performance of immunization programmes
- Compare the percentage immunization coverage rate with the objectives (targets) set for the immunization programme in the annual action plan.
- Compare the percentage immunization coverage rate with the equivalent data for the previous year.
- Compare the percentage immunization coverage rate of different vaccines given at the same time.
- Evaluate whether there is an access problem for the Health Post by calculating the Penta1 to Penta3 dropout rate.
- Evaluate whether there is a utilisation of health services problem for the Health Post by calculating the Penta1 to measles vaccine dropout rate; this also tells you the percentage of fully immunized children compared to the target population.
- Evaluate whether there is a problem in delivering TT+2 (more than two doses of TT vaccine) to pregnant and non-pregnant women of childbearing age.
For continuous self-monitoring at Health Post level, we suggest you use wall charts to record such indicators as actual immunization coverage rates for each quarter of the year, compared with the planned targets for that period (Figure 10.6).
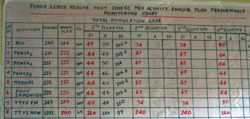
Figure 10.7 illustrates how to enter data into an immunization monitoring chart, in order to assess your monthly progress in meeting a 100% immunization coverage target.
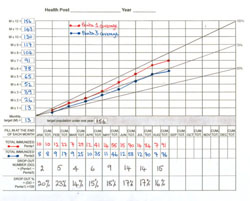
Every Health Post should display a chart like Figure 10.7 where it can be seen by all staff every day. The diagonal line from zero to the top right-hand corner (labelled 100%) shows the ideal rate of progress if every eligible infant is immunized on time.
What is your evaluation of the progress in meeting the Penta1 and Penta3 immunization targets in the (fictional) Health Post in Figure 10.7?
The Health Extension Practitioners have not improved their immunization coverage between January and August. Penta1 coverage has remained at about 85% of the target population, and Penta3 coverage has not exceeded 75%.
Next we discuss how to analyse immunization coverage and dropout data to shed light on what may be causing low coverage and/or high dropout.
10.3.2 Analysis of access and utilisation problems
The commonly used immunization coverage and dropout rate indicators, and what they may indicate, are summarised in Table 10.2.
| Indicator (%) | What it may indicate |
|---|---|
| Penta1 coverage | Availability of, access to, and initial use of immunization services by parents or caregivers |
| Penta3 coverage | Continuity of use by parents or caregivers |
| Measles coverage | Protection against a disease of major public health importance |
| Penta1 to Penta3 dropout | Access to the service by parents or caregivers, and quality of communication by health workers — this is an international dropout indicator |
| Penta1 to measles dropout | Utilisation of health services by parents or caregivers, and the perceived quality of the service in the community — this is an international dropout indicator |
| TT1 coverage during pregnancy | Availability of, access to, and use of immunization services by pregnant women |
| TT2+ (TT3, TT4 or TT5 coverage) TT2+ (or TT+2 as in Figure 10.6) means the women received more than two doses of TT vaccine. | Continuity of use, client satisfaction and capability of the system to deliver a series of immunizations to women |
| Fully-immunized children (FIC) | Capability of the system to provide all vaccines in the childhood schedule at the appropriate age, and at the appropriate interval between doses in the first year of life; also measures public demand and perceived quality of services |
Table 10.3 shows you how to assess whether low immunization coverage or high dropout rates are due to a problem of access (coming to the immunization services) or to a problem of utilisation (usage of immunization services). You should use the results of your assessment to identify and prioritise problems in your immunization programme, and work out possible solutions, as described in Section 10.4.
| Observation at Health Post level | Problems identified |
|---|---|
| High Penta1 coverage and low dropout rate | No problem |
| High Penta1 coverage and high dropout rate | Utilisation problem |
| Low Penta1 coverage and low dropout rate | Access problem |
| Low Penta1 coverage and high dropout rate | Access and utilisation problems |
10.4 What could be causing immunization problems?
Some possible local causes of low immunization uptake or high dropout rates are summarised in this section, which includes two new key terms (in bold).
Service organisation problems:
- Community not clearly informed of dates/times of immunization sessions at the Health Post, at outreach sites, or via mobile teams
- Immunization sessions not frequent enough, or at inconvenient sites
- Immunization session dates/times conflict with farming or family duties
- Poor vaccine quality, e.g. due to cold chain breakdown or usage after the expiry date
- Vaccine or other equipment shortages.
Staffing problems:
- Inadequate staffing levels to provide enough immunization sessions
- Inadequate training or supportive supervision for a high quality immunization service
- Health staff perceived as hostile or poor communicators by parents
- Incorrect contraindication practices, e.g. not immunizing children with minor illnesses, low grade fever, etc. which should not prevent them from receiving vaccines
- Missed opportunities to immunize, e.g. not immunizing children who visit the Health Post for another reason, unrelated to immunization.
Data collection and reporting problems:
- Incomplete or inaccurate data collection and analysis
- Failure to report monitoring data regularly
- No active follow-up of defaulters.
Can you suggest some possible solutions for the problems identified above?
You may have thought of these (and other) examples:
- Improved communication with the community (see Study Session 9)
- Better in-service training for health staff and adequate supportive supervision
- Mobilisation of additional resources, e.g. increased staffing levels, more reliable cold-chain equipment, better delivery times for vaccines and other supplies, etc.
- Apply other immunization strategies, e.g. sustainable outreach delivery, local immunization days, partnership with private and other sectors (see Study Session 8)
- Apply an effective system for tracing defaulters (see Section 10.5 below)
- Make timely, accurate reports to the higher level, so problems can be addressed collectively at the earliest opportunity.
We conclude this study session by explaining how the last two solutions in the above list should be implemented.
10.5 Systems for tracing defaulters
In this section you will learn how you trace (track) defaulters. Defaulters are those infants who started the routine EPI immunizations but failed to complete the schedule for whatever reason. If you trace defaulters regularly every month, it will make the task of follow-up much easier. You may be able to contact the mothers directly, or ask other members of the community to help you to find them. Try to ensure that every infant receives the immunizations that are overdue. There are many ways to monitor and follow-up on defaulters. Here we describe two tracking systems that can easily be used.
Using the EPI Registration Book
At the end of each month, review the EPI Registration Book to identify infants and mothers who have not received doses of vaccine at the appropriate time, according to the recommended EPI schedule.
Using reminder cards
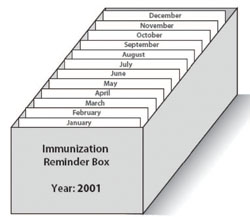
Make reminder cards, which are copies of the infant’s immunization cards. File them in a box behind the divider for the month when the infant’s next immunization is due (Figure 10.8). Refer to these every month to identify the defaulters.
10.6 Making immunization Summary Reports
The monitoring data you have collected on your immunization programme has to be organized into a Summary Report for transmission from the Health Post to the Health Centre that supervises you. The Health Centre collects data from all the satellite Health Posts and transmits it to the woreda (district) health office. The woreda compiles data from health facilities in the district for transmission to the higher level, and eventually to the Federal Ministry of Health. At each level the data should be analysed and used to improve the immunization programme.
10.6.1 What data should the Summary Report contain?
The Summary Report from your Health Post should include the following information:
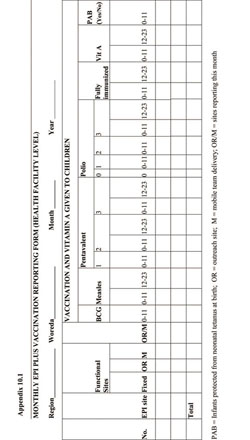
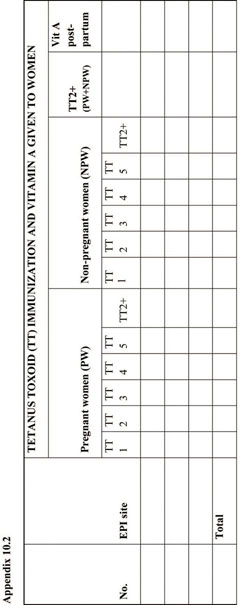
- Vaccinations and vitamin A supplements given to infants and women. Data collected on the tally sheets should be organised clearly (see the sample monthly report forms shown in Appendix 10.1 and 10.2 at the end of this study session).
- Vaccine-preventable diseases in your area. State the number of cases of each vaccine-preventable disease and the immunization status of each case. Even if there are no cases of a disease during the reporting period, you should still provide a ‘zero’ report.
- Adverse events following immunization (AEFI). If there have been any adverse events during the month, the details of any that are life-threatening, resulted in hospitalisation, disability (or have the potential to result in disability), or resulted in death should be reported. If there are no cases, provide a ‘zero’report.
- Vaccine usage and wastage patterns. The usage and wastage of vaccines will vary from one session to another. However it is useful to monitor wastage and usage patterns regularly at all immunization sessions, in order to improve supply and avoid stock shortages. This can be done by recording the number of vaccine vials at the start and end of every session, and the number of vials received or wasted each month.
Vaccine supply and stock management were described in detail in Study Session 5.
- Any specific problems encountered during the reporting period (e.g. stock shortages, transportation problems, cold chain failure, etc.).
10.6.2 Preparing good Summary Reports
You should ensure that the Summary Reports you prepare on your immunization service are:
- Complete: Ensure all the sections of the reports have been completed; no parts have been left blank and all reports due from outreach sites or mobile teams have been received.
- Timely: When reports are sent and received on time, there is a greater possibility of a prompt and effective response to any problems you have identified.
- Accurate: Before sending the reports, check the totals and all calculations to make sure that the reported figures correspond to the actual figures in the tally sheets, the EPI Registration Book and the immunization cards. This helps you to evaluate the accuracy of your recorded data and identify and resolve any discrepancies. The district, provincial and national levels should keep track of the completeness and timeliness of reporting at your level, and remind you about any missing or late reports.
10.7 In conclusion
Now that you have completed this Module, you should be well prepared for the practical skills training that accompanies it. Be proud that you have the opportunity to improve the health of your community and save many young lives by delivering a well-managed and effective immunization service.
Summary of Study Session 10
In Study Session 10, you have learned that:
- Monitoring of immunization programmes is very important for the planning and management of the EPI. It is the process of continuous observation and data collection, with the aim of comparing what you have achieved with your planning targets.
- Monitoring your immunization programme includes proper use of EPI recording tools: the infant immunization cards, the EPI Registration Book (Immunization Register) and the tally sheets for each immunization session.
- The Immunization Register helps you record the immunization services offered to each client. You must register infants and pregnant women as soon as they arrive at your Health Post or outreach site, before giving any immunizations or vitamin A supplements.
- Tally sheets are used as the basis of your monthly or quarterly Summary Reports.
- EPI indicators include Penta1 to Penta3 coverage, Penta1 to measles vaccine coverage, percentage of fully immunized children, percentage of women in the childbearing age-group (pregnant and non-pregnant) receiving more than two doses of TT vaccine, and protection at birth (PAB) against neonatal tetanus.
- Estimates of whether implementation of the immunization service will (or has the potential to) reduce the target EPI diseases are obtained through measuring immunization coverage rates and dropout rates for each vaccine.
- Pentavalent 1 coverage (and Penta1 to Penta3 dropout) is an internationally accepted measure of accessibility to the health facility; pentavalent 3 coverage (and Penta3 to measles vaccine dropout) is a measure of utilisation of health services.
- It is important to trace defaulters by using the immunization register or reminder cards.
- The immunization data collected should be organised into a complete, timely and accurate summary form. These reports enable you, your supervisor and the woreda health office to monitor the performance of your immunization service and quickly address any problems.
Self-Assessment Questions (SAQs) for Study Session 10
Now that you have completed this study session, you can assess how well you have achieved its Learning Outcomes by answering the following questions. Write your answers in your Study Diary and discuss them with your Tutor at the next Study Support Meeting. You can check your answers with the Notes on the Self-Assessment Questions at the end of this Module.
SAQ 10.1 (tests Learning Outcomes 10.1, 10.2 and 10.5)
In your Health Post, you use infant immunization cards to record immunizations given to each individual infant, and an EPI Registration Book to record the immunizations you have given.
- What other basic EPI recording tool should you be using and what two things does it enable you to do?
Answer
Tally sheets should also be used to record the number of doses and the lot number of each vaccine given during each immunization session. This enables you to check that the number of doses given tallies (matches) the number recorded in your Registration Book. It also acts as a way of monitoring the number of doses given, and enables you to complete your monthly Summary Report to the higher level. You may also have mentioned your Vaccine Stock Register (see Study Session 5).
SAQ 10.2 (tests Learning Outcomes 10.1 and 10.3)
The percentage of children in the target population who receive the first dose of pentavalent vaccine (Penta1), and the percentage who receive measles vaccine, are commonly used EPI indicators for monitoring an immunization programme. Name two other EPI indicators and, in each case, explain why they are particularly useful.
Answer
The percentage of children in the target population who receive the third dose of pentavalent vaccine (Penta3) is particularly useful, because it indicates the continuity of use of the immunization service by parents and caregivers. A low dropout between Penta1 and Penta3 indicates that parents and caregivers are able to access the service.
The percentage of fully immunized children (FIC) is another particularly useful indicator, as it demonstrates the capability of the system to provide all the vaccines in the schedule at the appropriate times. It also gives an indication of the public demand for the service. Low dropout between Penta1 and measles immunization demonstrates satisfaction with the perceived quality of the service in the community, and also that there is not a general problem of utilisation of health services locally.
SAQ 10.3 (tests Learning Outcomes 10.1, 10.3 and 10.4)
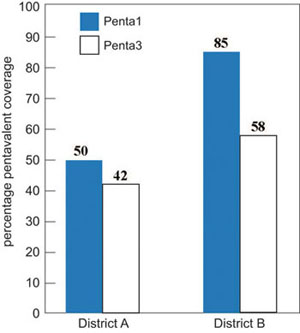
Figure 10.9 shows the percentage immunization coverage for Penta1 and Penta3 in two districts, labelled A and B. Based on the information in this figure, answer the following questions:
- a.Calculate the pentavalent dropout rate for the two districts A and B.
- b.Do the dropout rates suggest that access or utilisation is the major problem for the immunization service in each district? Explain how you reached your answer.
- c.What are the possible solutions for the problems in each district?
Answer
(a) Calculation of dropout rates.
District A:
Figure 10.10 shows that 50% of infants received pentavalent 1 vaccine, and 42% completed the three-dose schedule (using pentavalent 3 coverage as the indicator). The dropout rate is calculated using the equation:
Penta1 to Penta3 dropout rate = (Penta1 – Penta3) ÷ Penta1 x 100%
The dropout rate in District A is therefore (50 – 42) ÷ 50 x 100 % = 16%.
District B:
Figure 10.10 shows that 85% of infants received pentavalent 1 vaccine, but only 58% completed the three-dose schedule (received pentavalent 3). The dropout rate in District B is therefore:
(85 – 58) ÷ 85 x 100% = 32%.
(b) In District A, the major problem is low coverage, as only 50% of children received the first pentavalent dose, which indicates an access problem for parents or caregivers. In District B, the major problem is the high dropout rate of 32%, which indicates a general problem of utilisation of health services.
c) In District A, priority should be given to raising the pentavalent 1 coverage rate, by aiming to immunize the 50% of children who have never been reached by the immunization service. In District B, the priority should be given to following up on defaulters and persuading them to complete the schedule of immunization, so the pentavalent 3 coverage rate rises from 58% to closer to the 85% who received pentavalent 1.
SAQ 10.4 (tests Learning Outcomes 10.1, 10.3 and 10.4)
In a kebele with a total population of 5,000, an estimated 3.6% are surviving infants under 12 months old. In September, nine infants aged under one year and two children aged between 12 and 23 months old were immunized against measles.
- a.What was the measles immunization coverage rate for infants aged under one year in September? Is it lower or higher than the estimated total population of eligible infants in that month? (You can assume that approximately the same number of babies is born alive each month.) Show how you reached your answers.
- b.List some possible reasons for the measles immunization coverage rate in this kebele.
- c.What actions would you take to improve the coverage with measles vaccine?
Answer
- a.An estimated 3.6% of the population of 5,000 in the catchment area are under one year of age and therefore eligible for measles immunization. The total eligible population of infants in this age-group is calculated as follows: 5,000 x 0.036 (or 3.6%) = 180 infants You would expect about 15 of these infants to have been born each month of the year (180 ÷ 12 = 15). However, only nine infants received measles vaccine during September, so the measles vaccine coverage for September was (9 ÷ 15) x 100% or 60%.
- b.The measles immunization coverage rate of only 60% is low, and indicates a problem with utilisation of health services for parents or caregivers.
- c.Possible actions you could take to try to reach more infants in the target age group could include:
- more house-to-house visits in remote areas (using mobile teams)
- more outreach immunization sessions
- ensuring that no opportunities are missed to immunize eligible infants with measles vaccine, e.g. if they are brought to the Health Post for another reason, or when you are visiting the family
- more effective tracing of defaulters by checking entries in the EPI Registration Book every month, and using reminder cards to tell you which infants are due for their next immunization in which month.
SAQ 10.5 (tests Learning Outcomes 10.1 and 10.5)
Meseret completed the Summary Report of the immunization service delivered from her Health Post for the previous month. She carefully recorded the number of doses of vaccines and vitamin A supplements given to infants and women in her catchment area during the reporting period. There were no cases of vaccine-preventable diseases and no serious adverse events following any of the immunizations, so she left this part of the report form blank. She recorded the number of vaccine vials she used during the month and the number wasted. Then she sent the report form to her supervisor.
- a.What mistake did Meseret make when she entered her data in the Summary Report?
- b.What other types of data did she forget to include in the Summary Report?
Answer
- a.Meseret’s mistake was leaving the Summary Report blank where she should have recorded ‘zero’ for cases of vaccine-preventable diseases and any serious adverse events following immunization.
- b.Meseret’s Summary Report should also have included:
- the number of vaccine vials she received as new stock during the month
- any specific problems encountered during the reporting period, e.g. stock shortages, transportation problems, cold chain failures, etc.
