Use 'Print preview' to check the number of pages and printer settings.
Print functionality varies between browsers.
Printable page generated Sunday, 26 July 2026, 3:31 AM
Analysing pesticides in the environment using gas chromatography with mass spectroscopy (GC-MS)
Introduction
In this series of activities you will learn about gas chromatography and mass spectroscopy, and you will use the techniques to assess the water quality in a tidal bay in China. In particular you will look for a particular class of pesticides and measure their concentration. This will involve developing a hypothesis and devising a plan to sample the water in the bay that will best test your hypothesis. You will also learn something of the chemical structures of the pesticides.
Carefully reading the text and watching the video clips will help you answer in-text questions designed to consolidate your learning of the key concepts. For those students in Scotland working on the Curriculum for Excellence this experiment links to Higher Chemistry as follows
Main outcomes for Curriculum for Excellence Higher Chemistry
- ‘Chemical analysis’ in ‘Chemistry in Society’ Unit – chromatography ‘Uses of chromatography. Differences in the polarity and/or size of molecules.’
- Develop approach to problem solving exam questions which require ‘applying knowledge, understanding and skills in unfamiliar contexts’ ‘Marks will be awarded for applying scientific inquiry, scientific analytical thinking and problem solving skills’
- Develop skills towards Researching Chemistry Unit (‘to plan and undertake a practical investigation and analyse results’)
Learning outcomes
The investigation will build your knowledge and skills in the following areas:
Chromatography and its uses
Develop approach to problem solving through applying scientific inquiry, scientific analytical thinking and problem solving skills
Planning and undertaking a practical investigation and analysing results
1 Water is precious
Water is our most precious resource. Without water, life on Earth, including humans, would not exist. The need to value water is becoming more critical in the face of global issues such as a changing climate and increasing human population. This is not only the case in arid and less economically developed parts of the world, but also in wetter, more developed countries such as the UK.
Monitoring water quality is a key aspect in managing our water so that we and future generations have what we need and so that the environment is protected. Human activities, natural landscape features and atmospheric contributions can all have an effect on water quality (Figure 1).

In broad terms, water quality can be seen as the chemical, physical and biological characteristics of water, and is measured against requirements for human or other species/ecosystem uses. Such requirements often take the form of standards (such as for drinking water or ecosystem health) against which samples can be assessed to check compliance with regulations.
2 The problem of pesticides
This investigation considers the presence of organic compounds in water. These are carbon-containing compounds, generally man-made in origin, and include crude oil and its derivatives, detergents, and pharmaceuticals and their metabolites. But perhaps the class of organic compounds that cause the most concern when present as contaminants in water, owing to their toxicity, is pesticides.
The term ‘pesticide’ encompasses a wide range of organic compounds used to control weeds (herbicide), fungi and moulds (fungicide), insects (insecticide) and pests (pesticide). Traces of these compounds may enter rivers and surface water as run-off from agricultural land (where they are used to protect crops) or via non-agricultural use (for example, the use of herbicides to control weeds along motorway verges). They may also percolate through soil into ground water.
A particular class of pesticides known as organochlorine pesticides (OCPs) are now banned in many countries. An example is dichloro-diphenyl-trichloro-ethane (DDT). This class of pesticides is very persistent, remaining active in the environment for a long time after initial contamination. Such chemicals may still be observed in samples many years after they have been banned. A number are, however, still in use in lower- and middle-income countries.
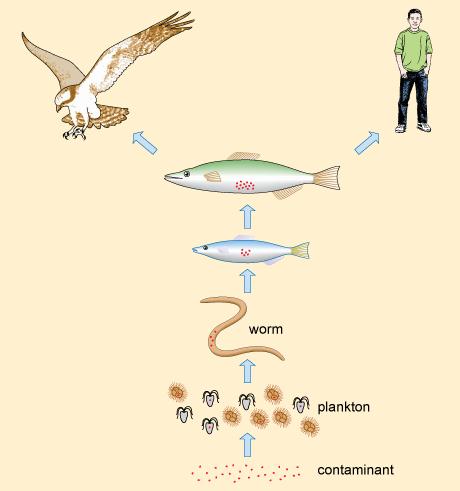
Pesticides can also become increasingly concentrated in organisms as you move up the food chain, as species consume greater quantities at each level (Figure 2). This process leads to there being much greater concentrations of the pesticide in affected organisms than was initially present in the water itself.
Pesticides, in addition to their inherent toxicity to many species, include a class of chemicals that may play a role in a range of health problems from reproductive abnormalities to defects of the immune and nervous systems to cancer. An example of this type of chemical is dieldrin, one of the OCPs. This was once a widely used insecticide, although it is now banned in the EU.
3 What you’ll be doing in this investigation
In this investigation you will be using the technique of gas chromatography together with mass spectrometry (a combination also known as ‘GC–MS’) to evaluate the environmental contamination of a tidal bay in China by the class of persistent organochlorine pesticide.
You will first develop a hypothesis and sampling plan, choosing which sites to sample in the bay. You will then use GC–MS qualitatively to identify any pesticides present in your samples and quantitatively to determine the concentrations of the pesticides you have found.
By the end of this investigation you should be able to:
- devise a sampling plan
- understand how chromatography is used to separate mixtures of compounds
- compare mass spectra of individual pesticides with a ‘pesticide’ library to identify particular compounds present in a mixture
- determine the concentrations of individual pesticides present in a sample
4 The chemical structure of pesticides
Examples of the pesticides that you will be analysing are given in Table 1.
| Pesticide | Molecular formula | Structure | Information Footnotes a |
| Aldrin | C12H8Cl6 | 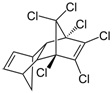 | pesticide (banned but restricted use as a local insecticide) |
| Dieldrin | C12H8Cl6O | 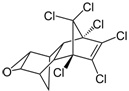 | insecticide (banned but restricted use for agricultural purposes) |
| Dichlorodiphenyltrichloroethane (DDT) | 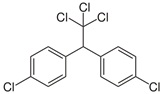 | pesticide (banned but restricted use for malaria control) | |
| Endosulfan | C9H6Cl6O3S | 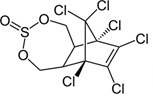 | insecticide (banned only recently, still in use in China and India) |
| Endrin | C12H8Cl6O | 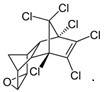 | insecticide and rodenticide (banned) |
| Hexachlorocyclohexane (αHCH) |  | pesticide (banned) | |
| Lindane (γ-HCH) | C6H6Cl6 |  | insecticide (banned but restricted pharmaceutical use for treatment of lice and scabies) |
| Heptachlor | 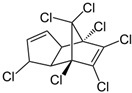 | insecticide (banned but restricted use use as a termiticide) | |
| Methoxychlor | 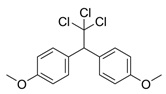 | insecticide (banned in US and EU) | |
| Pentachloronitrobenzene (PCNB) | C6Cl5NO2 |  | fungicide |
Footnotes
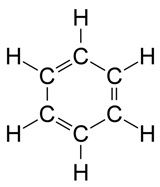
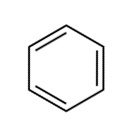
Footnotes a Banned status according to the United Nations Treaty (known as the Stockholm Convention on Persistent Organic Pollutants), which has been signed by the majority of countries. One notable exception is the USA, which has its own list of banned substances covering many of the same pesticides.Look at the pesticide structures in Table 1. Most of these probably look more complicated than the sorts of things you’ve seen before but they follow just the same principles as simpler molecules. To simplify them carbon and hydrogen atoms aren’t labelled in these skeletal structures, but we need to remember them. To get a feel for this, Figure 3 shows two alternative ways of depicting a benzene ring, with the structure on the right corresponding to the method used for the pesticide structures in the Table.
 |  |
5 The chemical structure of pesticides continued
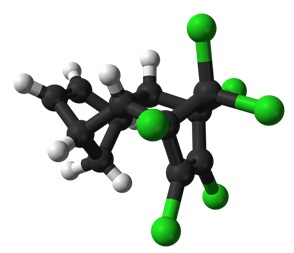
Some of the structures in Table 1 also convey the 3D nature of the molecules. Solid wedges represent bonds pointing towards you out of the paper and dashed wedges represent bonds pointing away from you below the paper. Look at the 3D structure of Aldrin in Figure 4 and compare it with the structure in Table 1. Can you see that the green balls are the chlorine atoms, the black balls are carbon atoms, and the white balls are hydrogen atoms?
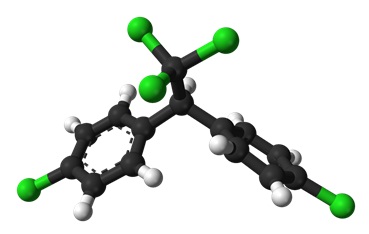
We can work out the molecular formulas for the pesticides by counting the atoms in the structures. For example in DDT (third row in Table 1) we can count 14 carbon atoms (14 junctions between bonds. To count the hydrogen atoms, which are not shown in these structural formulas, the valency of carbon is important.
What is the valency of carbon?
Answer
Carbon is in group 4 of the periodic table so has valency 4.
Each carbon atom must have four bonds, to match the valency. In DDT the carbon atoms bonded with any of the chlorine atoms already have four bonds but some of the other carbons atoms only have three – there must be a ‘missing’ hydrogen atom here. Counting these gives nine hydrogen atoms. The molecular formula for DDT is therefore C14H9Cl5. To help confirm this, the 3D structure of DDT is shown in Figure 5.
- Following this example, work out each of the molecular formulas that are missing in the table.
| Pesticide | Molecular formula | Structure | Information Footnotes a |
| Aldrin | C12H8Cl6 | | pesticide (banned but restricted use as a local insecticide) |
| Dieldrin | C12H8Cl6O | | insecticide (banned but restricted use for agricultural purposes) |
| Dichlorodiphenyltrichloroethane (DDT) | | pesticide (banned but restricted use for malaria control) | |
| Endosulfan | C9H6Cl6O3S | | insecticide (banned only recently, still in use in China and India) |
| Endrin | C12H8Cl6O | | insecticide and rodenticide (banned) |
| Hexachlorocyclohexane (αHCH) | | pesticide (banned) | |
| Lindane (γ-HCH) | C6H6Cl6 | | insecticide (banned but restricted pharmaceutical use for treatment of lice and scabies) |
| Heptachlor | | insecticide (banned but restricted use use as a termiticide) | |
| Methoxychlor | | insecticide (banned in US and EU) | |
| Pentachloronitrobenzene (PCNB) | C6Cl5NO2 | | fungicide |
Footnotes
Footnotes a Banned status according to the United Nations Treaty (known as the Stockholm Convention on Persistent Organic Pollutants), which has been signed by the majority of countries. One notable exception is the USA, which has its own list of banned substances covering many of the same pesticides.6 Getting into the laboratory - Gas chromatography
In this investigation you will be using GC–MS to identify pesticides present in a sample of water (qualitative analysis). You will also work out their concentrations (quantitative analysis)
The first step in the process of investigating the presence and concentration of pesticides in a water sample is to extract the pesticides from the water using an organic solvent (the samples in water cannot be analysed using GC–MS). Then any residual water is removed using a drying agent, such as anhydrous sodium sulfate. The organic solution is then concentrated using an evaporation process. This mixture of organic compounds dissolved in the organic solvent can then be separated into its constituents using the process of gas chromatography.
The organic solvent containing the pesticide mixture is injected into a gas (the mobile phase). This gas is passed through a column containing a material that interacts with the pesticides in the mixture (the stationary phase). The speed at which the components of the sample move through the column depends on how much they interact with the stationary phase, which in turn depends on their physical and chemical properties. Thus the different pesticides will become separated.
For example, a compound may temporarily condense on the stationary phase slowing down its passage through the column. This will depend on the boiling point of the compound. A compound with a lower boiling point – a more volatile compound – will spend more time in the mobile phase and so pass more quickly through the column.
7 Differences between compounds - size of molecules and polarity
There are various factors which affect how volatile a compound is, that is, how easily it converts to a gas. One factor is the size of the molecule. When comparing molecules of similar composition smaller molecules tend to be more volatile than larger molecules. The alkane series demonstrates this - methane, ethane, propane, butane, pentane, and so on all have increasing boiling points.
A second factor is intermolecular forces – forces between molecules. The greater these are the less volatile a compound is (the higher the boiling point). This depends on the polarity of the molecules which is due the way electrons are distributed over the molecule - the extent to which the charge is uneven or separated determines the polarity of the molecule.
Most compounds containing only carbon and hydrogen are non-polar; however, those organic molecules also containing electronegative atoms such as oxygen and nitrogen tend to be polar. The organochlorine pesticides in this investigation contain chlorine atoms which are electronegative, but, in general, these molecules are relatively non-polar as there is little charge separation.
Would you expect a non-polar compound made up of small molecules to move quickly or slowly through the column in gas chromatography?
Answer
A non-polar compound made up of small molecules will be more volatile so will move quickly through the column.
Another consequence of polarity is that if the polarity of the stationary phase and compound are similar then the compound will interact more strongly with the stationary phase so slowing the movement of the compound through the column.
8 Gas chromatography in practice
The video clip provides some further background to gas chromatography, as well as demonstrating the practical aspects of this technique. Once you have watched this you should answer the questions below.
Watch the gas chromatography video (this takes you to an external website). (Open this link in a new window, so you can get back to the instructions easily.)
The video referred to the retention time of a compound. What is the meaning of this term and on what factors will it depend?
Answer
The retention time is the time taken for a particular compound to elute from or leave the column. This will depend on the stationary phase, length of the column, its temperature and the flow of the gas, as well as the properties of the compound itself.
How does the peak area for a compound change with concentration?
Answer
The peak area increases with increasing concentration of a particular compound.
9 Gas chromatography in practice continued
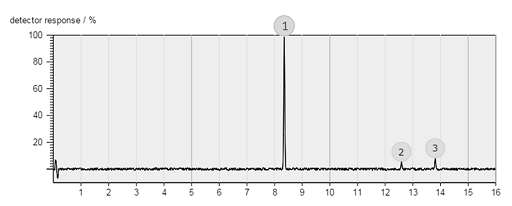
Figure 6 shows an example of a chromatogram for a range of different pesticides. Each pesticide is shown as an individual peak with different retention time.
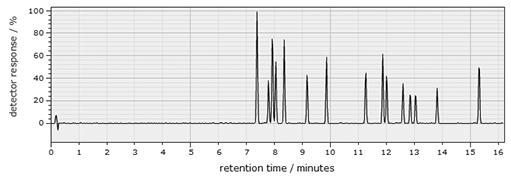
How could retention time be used to identify the pesticides in a mixture?
Answer
Standards containing the different pesticides could be used to determine the retention times of particular pesticides, which can then be compared to the retention time of the peaks in the sample.
Although the retention time of a particular compound can be matched against that of a standard, the differences in retention time between different compounds can be small. Chromatography combined with mass spectrometry (GC–MS) is often used to conclusively identify a substance.
10 Mass spectroscopy
Mass spectrometry can be used to provide a ‘fingerprint’ of the different pesticides or compounds. In mass spectrometry the molecules are bombarded with high energy electrons to cause some of the molecules to break up into smaller positively charged particles, or fragment ions. All the ions are accelerated and then subjected to a magnetic field that bends (deflects) the ions by different amounts depending on their mass or, strictly speaking, their mass to charge ratio (m/z). Light ions are deflected most, while heavy ones tend to go straight on. A detector measures how much ions are deflected which is used to produce a mass spectrum.
The mass spectrum of the pesticide lindane is shown in Figure 7.
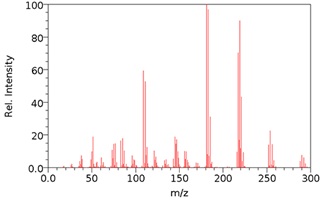
What is the relative molecular mass of lindane, C6H6Cl6?
Answer
Considering the mass of its constituent atoms the relative molecular mass of lindane can be calculated as:
(6 × 12) + (6 × 1) + (6 × 35.5) = 291 atomic mass units
Although a small peak due to the molecular or parent ion is present, the mass spectrum itself is complex, reflecting the different possible fragment ions that are produced. Rather than analysing the peaks in the mass spectrum of each pesticide and building up the structure in that way, the spectrum can be compared with a ‘library’ of mass spectra of a range of different pesticides/related molecules. This is what you will be doing in this investigation to identify any pesticides present in your samples.
11 Your task
The key objective of the investigation is to determine the presence/level of organochlorine pesticides (OCPs) in the Chinese coastal bay shown in Figure 8. The bay covers an area of approximately 380 km2 and is fed by a number of rivers running from mainly agricultural land, where the use of OCPs has, in the past, been widespread.
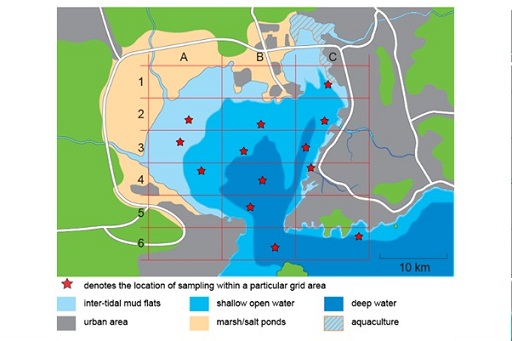
The area surrounding the bay is densely populated; the eastern shore is a largely built up, urban and industrial area with a major port. The bay is tidal with a small opening in the south into the Yellow Sea. The northern shore consists of intertidal flats, which are submerged at high tide but exposed at low tide, salt ponds and a number of ponds used for the cultivation (aquaculture) of shellfish. The bay, like many coastal regions in China, suffers from algal blooms due to high nutrient levels
In order to determine the levels of OCPs in the bay you need to decide which sites to sample. To help you do this most efficiently first think of a hypothesis you would like to test. It is important to compare results with a ‘null hypothesis’. For example, suppose that we want to evaluate pollution from a point source (such as a river or a sewage pipe) into a lake. An example of a null hypothesis would be that there is no change in concentration of a pollutant across the lake, irrespective of its distance from the point source. To test this you might take one sample at the point source and another one or two for comparison at a distance from the point source
- Discuss and form a hypothesis about the concentration of pesticides in the tidal bay area. Use the map and information which follows it, as well as the information given in Table 2 about the particular sampling location for each grid area to help you.
To help you refer to the map and table together it will be useful to copy the table into a Word document. Highlight Table 2 and press Ctrl-C, then open a Word document and press Crtl-V. You may need to adjust the zoom which is in the ‘View’ menu in Word.
- Assume that this is an initial study and you are only able to sample a limited number of sites within the bay. Develop a sampling plan that will test your hypothesis.
Think about:
- Where are the best sites for the sampling?
- How many samples should be taken?
- Write down your hypothesis, null hypothesis and sampling plan.
| Grid reference | Description of location |
| C1 | intertidal flats, close to an area developed for aquaculture |
| A2 | intertidal flats |
| B2 | shallow open water |
| C2 | shallow open water, not far from an estuary of a major river |
| A3 | intertidal flats |
| B3 | shallow open water |
| C3 | deep sea water |
| A4 | shallow open water |
| B4 | deep sea water |
| C4 | shallow open water, in an estuary at the mouth of a major river; is also close to a major port |
| B5 | deep sea water in the inlet into the bay |
| B6 | deep sea water in the inlet into the bay |
| C6 | shallow open water |
Footnotes
Note that no samples were taken in the following sections of the grid: A1, B1, A5, C5 or A6.12 So, let’s get sampling!
Analysing a standard sample
First you will run the GC–MS of a standard sample containing a mixture of pesticides and their metabolites, and use a pesticide library to identify the organic compound that elutes at each retention time.
- Go to the GC-MS laboratory and click on ”Enter experiment” (open this link in a new window, so you can get back to the instructions easily, you may wish to sign up for this site).
- Click on the ‘Reference’ tab to run the GC–MS spectrum of the standard mixture, following the instructions on screen.
- Note the retention time of each peak in your notebook. You may find it helpful to draw a table for this. Alternatively, you could copy the data values from the output, and paste them into a spreadsheet.
- Click on the number above a peak in order to see the mass spectrum of this pesticide. A library of spectra from known pesticides will also open. Use this pesticide library to identify which pesticide/metabolite is present at that particular retention time and make a note of this in your notebook. Repeat this process until you have identified all the peaks in the standard.
A peak in the chromatogram has a retention time of 8.05 min. Using the information you derived from the standard and the pesticide library, identify the pesticide that elutes at this time.
Answer
Pentachloronitrobenzene, PCNB, has a retention time of 8.05 min.
13 Analysing samples from the bay
- Click on the ‘Sampling’ tab within the software, and choose one of the sampling sites that you selected in your sampling plan to analyse using GC–MS.
- Move to the ‘Analysis’ tab and run the GC–MS spectrum of your first sample. The retention time of each peak is provided in the table in the software, together with the peak areas. You should use a second table to make a note of these data in your notebook. To run replicate analyses, press ‘Clear’ then ‘Run’. You should take the mean of the peak areas for the different peaks identified.
- Use the data that you derived from the standard and the pesticide library to identify any pesticides present and record your findings in your table. (You may view the mass spectrum of each pesticide by clicking on the number above each peak to confirm this, should you wish to.)
- Repeat this process for the other samples sites that you selected.
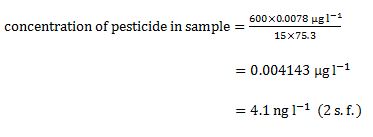
14 Calculating concentrations
Now that you have identified the pesticides present at each of your sample locations, your next task will be to complete a quantitative analysis of the samples.
Remember that the concentration of a particular pesticide can be determined from its peak area. This would be done by first comparing with standards of known concentration of that pesticide using a calibration graph.
We can use the following equation to calculate the concentration of each pesticide:
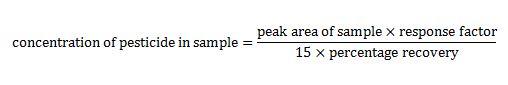
Click on 'reveal answer' if you’d like to know what the ‘response factor’ and ‘percentage recovery’ mean.
Answer
DETAILS OF TERMS USED IN THE EQUATION
The response factor for each pesticide is the ratio of pesticide concentration to peak area. This can be determined from the gradient of a calibration graph that plots peak area against concentration for calibration standards.
The percentage recovery (‘recovery %’) is the percentage of the pesticide compound that can be recovered during the solvent extraction phase. It is determined using a standard where a known mass has been introduced into a sample before the extraction and then measured after the extraction process to see how much of that mass is recovered. Generally, the extraction process is controlled so that a percentage recovery of approximately 90% is achieved.
The water samples taken had a volume of 1500 ml, which were concentrated during the preparation step to 1 ml. This leads to the factor of 15 in the equation.
Table 4 lists the response factors for the range of pesticides analysed, as well as their percentage recovery.
| Pesticide/metabolite | Response factor/μg l-1 | Recovery/% |
| Aldrin | 0.0078 | 75.3 |
| p,p’-DDD Footnotes a | 0.0379 | 93.1 |
| p,p’-DDE Footnotes a | 0.0088 | 90.0 |
| o,p’-DDT Footnotes b | 0.0158 | 79.1 |
| p,p’-DDT | 0.0175 | 88.2 |
| Dieldrin | 0.0123 | 94.4 |
| Endosulfan | 0.0109 | 89.9 |
| Endrin | 0.0152 | 88.9 |
| α-HCH Footnotes c | 0.0064 | 102.1 Footnotes d |
| β–HCH Footnotes c | 0.0159 | 101.6 Footnotes d |
| γ–HCH (lindane) | 0.0078 | 110.7 Footnotes d |
| δ–HCH Footnotes c | 0.0087 | 102.9 Footnotes d |
| Heptachlor | 0.0097 | 72.1 |
| Methoxychlor | 0.0098 | 97.0 |
| PCNB | 0.0089 | 79.5 |
Footnotes
Footnotes a metabolite resulting from the breakdown of p,p’-DDT in the environment. The p, p’ and o is notation given to different isomers.Footnotes
Footnotes b minor isomer present in commercial DDFootnotes
Footnotes c present in commercial HCH (also with γ-HCH)Footnotes
Footnotes d recoveries of greater than 100% can result from uncertainties in determination of the analyte concentrationTry the following example before you analyse your own results:
15 What do your results tell you?
- Discuss whether your results support your hypothesis. Write down your conclusions.
- Answer the following questions:
- How many samples did you take? Which sample sites did you choose and why?
- Could you improve your sampling plan?
- In what other ways would you change what you did?
16 Testing your understanding
Define and describe chromatography using the following key terms:
- Mobile phase
- Stationary phase
- Gas Chromatography
Answer
Chromatography is a laboratory technique for separating mixtures.
The mixture to be analysed travels in a mobile phase (which may be a liquid or gas) which passes through a stationary phase. The interaction that compounds in the mixture have between the mobile phase and the stationary phase determines the speed at which they travel. This separates the different compounds.
In gas chromatography the mobile phase is an inert gas such as helium which flows through a column coated with the stationary phase.
The figure below shows an example chromatogram.
What should the label on the horizontal axis be?
Answer
Retention time/minutes (Remember units!)
Which of the three compounds is the most volatile?
Answer
Compound 1 is the most volatile because the retention time is the shortest.
Which is of the three compounds has the highest concentration?
Answer
Compound 1 has the highest concentration because the peak area is largest.
Use your results or return to the GC-MS laboratory to answer the following question.

Extra materials for interested pupils
Video clip on mass-spectroscopy (this takes you to an external website)
17 To summarise
In this investigation you devised a sampling plan to test your hypothesis. You also learnt how chromatography is used to separate mixtures of compounds and how a 'sample' library can be used to identify particular compounds present in a mixture using mass spectrometry. You applied these techniques in the qualitative analysis of pesticides in samples collected from a coastal bay. You also did a quantitative analysis by determining the concentrations of pesticides present in your selected samples by using the peak areas on the chromatograms.
Experiment complete
If you have enrolled on this short course and worked through all the online materials for this experiment you are eligible for a Statement of Participation which you will receive via email.
If you are interested in other online Science experiments, visit the OpenScience Lab. You can also find many short free courses on Science on OpenLearn
Acknowledgements
This course is an adapted extract from the Open University course S288 Practical science and was developed as part of the Opening Educational Practices in Scotland (OEPS) project funded by the Scottish Funding Council, which supports and builds best practice in open education in the Scottish HE, colleges and third sectors.
Course team
Amanda Law (Lead Contributor)
Dave Edwards (Lead Contributor)
Pete Cannell (Contributor)
Ronald Macintyre (Contributor)
Rosemarie McIlwhan (Contributor)
Anna Page (Contributor)
Tim Smith (Contributor)
Open University S288 course team (original authors)
Except for third party materials and otherwise stated in the acknowledgements section, this content is made available under a Creative Commons Attribution-NonCommercial-ShareAlike 4.0 Licence.
The images in this material are Proprietary and used under licence (not subject to Creative Commons Licence). Grateful acknowledgement is made to the S288 module team for permission to reproduce material in this unit.
Every effort has been made to contact copyright owners. If any have been inadvertently overlooked, the publishers will be pleased to make the necessary arrangements at the first opportunity.
Don't miss out:
1. Enjoyed this? Find out more about this topic or browse all our free course materials on OpenLearnand OpenLearn Create
2. Join over 200,000 students, currently studying with The Open University
3. Outside the UK? We have students in over a hundred countries studying online qualifications