Use 'Print preview' to check the number of pages and printer settings.
Print functionality varies between browsers.
Printable page generated Tuesday, 21 July 2026, 10:29 PM
Testing for genetic variations using Quantitative PCR analysis (polymerase chain reaction)
Introduction
In this investigation you will perform genetic testing to identify individuals with differing numbers of functional genes. This can have significant effects on the amount of particular proteins that are synthesised and consequently on the ability to metabolise certain prescription drugs. You will also compare different human populations and so recognise the impact this has on designing safe and effective drugs. To do this you will use a laboratory technique called the polymerase chain reaction (PCR).
Carefully reading the text and watching the video clips will help you answer in-text questions designed to consolidate your learning of the key concepts. For those students in Scotland working on the Curriculum for Excellence this experiment links to both Higher Biology and Higher Chemistry as follows:
Curriculum for Excellence Higher Biology
Working through the experiment and associated background material will revise and consolidate some key areas in the ‘DNA and the genome’ Unit in addition to understanding PCR itself. It is designed to be carried out sometime after Topic 2 ‘Gene expression’ has been studied (rather than immediately after PCR in the course support notes) and it may be helpful to have also covered mutations in Topic 3 ’Genome’.
Curriculum for Excellence Higher Human Biology
Working through the experiment and associated background material will revise and consolidate some key areas in Topic 2 ‘Structure and function of DNA’ in the ‘Human Cells’ Unit in addition to understanding PCR itself. It is designed to be carried out sometime after Topic 2 has been studied.
Learning outcomes
The investigation will build your knowledge and skills in the following areas:
Amplification of DNA using Polymerase chain reaction (PCR)
Revise the processes of transcription and translation – how DNA codes for proteins
Genetic variation
Develop approach to problem solving through applying scientific inquiry, scientific analytical thinking and problem solving skills
Planning and undertaking a practical investigation and analysing results
1 Testing for genetic variations using Quantitative PCR analysis (polymerase chain reaction)
What is a drug?
All of us, at some stage in our lives, are likely to receive medication for an illness. By the age of 65, 80% of the UK population are taking a prescribed medicine and many will be receiving multiple medicines. However, many people fail to respond to the drugs they are being treated with, and in some cases the unwanted occurs: an overreaction with side effects or potentially severe consequences. What is the biological basis of this variability? This investigation will help to answer this question.
Drugs are substances that interact with biological systems and change their behaviour or activity. Most drugs are processed in the body into what are called drug metabolites. The metabolite is the active form (for example, codeine is converted in your body to morphine which in turn affects the perception of pain).
How well your body processes a particular drug depends upon many things:
- how much you have of the protein that processes that drug
- whether other drugs are present that might interfere with the processing
- how well your body absorbs or excretes the drug and its metabolites.
The effect of genetic variation between individuals results in individuals metabolising drugs at different rates. In this investigation you will examine genetic variations that contribute to the level of a particular protein that is given the abbreviation CYP2D6. This protein is important in the metabolism of almost 20–25% of the most commonly prescribed 100 medicines.
In the PCR laboratory you will perform genetic tests for two variants of the CYP2D6 gene that can have significant effects upon the level of the CYP2D6 protein it codes for and consequently on the ability to metabolise certain prescription drugs. In order to understand the significance of these variants, let’s first revise the relationship between the DNA code and the resultant protein.
2 DNA to protein
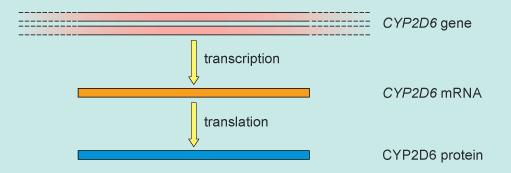
The flow of information from DNA to protein
The genetic information encoded within the DNA of a gene is carried via an intermediary molecule, RNA (ribonucleic acid), which is then used by the cell to make a protein (Figure 1).
There are two separate steps in this information flow:
- from DNA to RNA – a process called transcription
- from RNA to protein – a process called translation.
3 From DNA to RNA: transcription
The DNA strand region that is occupied by the CYP2D6 gene stretches over tens of thousands of bases, and during transcription this whole region of DNA is copied into an RNA chain. The order of the bases is copied exactly, but RNA uses a base called uracil in place of thymine.
Can you recall the other three bases that RNA has in common with DNA?
Answer
Adenine, cytosine and guanine.
The bases in RNA are therefore abbreviated as A, C, G and U.
However, before RNA is used as a template for protein synthesis, one further processing event occurs. Within the RNA strand are small segments called exons that actually carry the code that will direct protein synthesis. Before translation can occur, the RNA copy of the CYP2D6 DNA is processed as shown in Figure 2, so that all the intervening segments (introns, black thin lines) between the protein-coding exons (orange boxes) are removed. This forms a shorter RNA molecule that encodes the 497 amino acid CYP2D6 protein. This processing occurs by a series of cutting and joining reactions called splicing and leaves only small portions of non-protein-coding portions of RNA at either end (dark orange). The exact sites at which this occurs are dependent upon a series of bases in the RNA strand that lie within the intron.
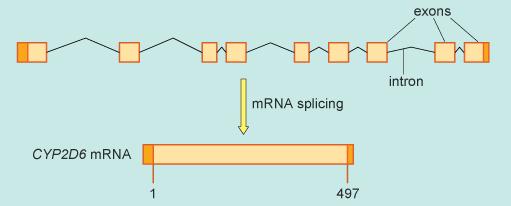
The segments of genetic code for the CYP2D6 protein are found in nine exons and the final spliced version of the RNA is called messenger RNA (mRNA).
4 From RNA to protein: translation
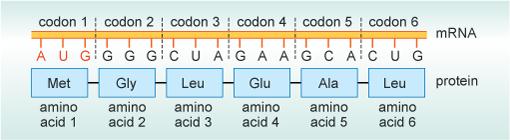
The base sequence of an RNA molecule, which is copied from the DNA, is converted into the amino acid sequence of a protein chain. In doing so, the cell must translate the four-character language of RNA (the four bases, A, C, G and U) into the corresponding 20-character language of a protein (the 20 naturally occurring amino acids). The code in mRNA consists of consecutive three-base sequences, or triplets. Each triplet is called a codon. Each codon codes for a particular amino acid.
Let’s explore this with a particular example. Suppose that a sequence of bases in a tiny section of an mRNA molecule is
…AUGCCUGCUGUUGGAAAG…
This message forms a series of three-letter ‘words’, or codons. In this example they would be
–AUG–CCU–GCU–GUU–GGA–AAG–
Each of these six codons codes for a different amino acid. For example, the RNA codon AUG codes for the amino acid methionine (abbreviated to Met) and CCU codes for the amino acid proline (Pro). The sequence of codons within a molecule of RNA enables the sequence of amino acids in the protein to be determined, as shown in Figure 3.
5 Gene variant
Sometimes things can go wrong — one form of mutation
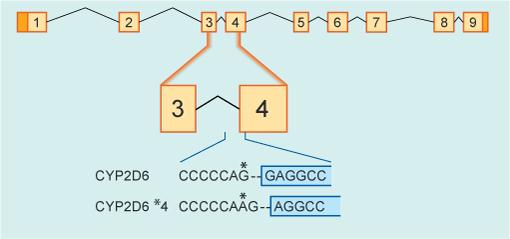
Thinking back to the formation of mRNA, if the bases at or near the sites of splicing are mutated in any way, splicing goes wrong. In this case, portions of RNA that do not code for a protein are left in the mRNA and, in all likelihood, the encoded protein will not be properly synthesised and will be degraded in the cell. In Figure 4 you can see an example of one such gene variant that alters splicing of exon 3 to exon 4. A single base change from G to A (indicated in the figure by *) leads to a shift in the position of mRNA processing by a single base. This variant is called the CYP2D6*4 (pronounced ‘star four’) variant and detecting it is one of the genetic tests you will be performing in this investigation.
6 Other variations — copy number
In a second test you will measure gene copy number. Analysis of the human genome sequence (the complete set of genetic information for humans) has led to a surprising and remarkable discovery about the structure of certain regions of the genome. Long segments appeared to be identical to regions elsewhere in the genome. These duplicated segments are complete copies of entire segments of DNA sequence with all the genes in the region being duplicated. In fact, almost 5% of the human genome is made up of this type of duplication. Some segments are present as three or even more copies, and in some cases they can even be completely deleted.
What would you predict would be the level of CYP2D6 enzyme activity in an individual who carried four copies of the CYP2D6*4 gene in total?
Answer
As this version of the gene produces a non-functional protein, even carrying four copies of the gene will still mean this individual has no enzyme activity.
As the number of copies of a gene can vary between individuals, it is perhaps no surprise that it results in differences in the level of RNA being synthesised, with a subsequent increase in the amount of protein being made.
This activity allows you to screen for these two variants in three populations. These data allow you to make comparisons between the populations, predict which individual will have high levels, low levels or no CYP2D6 protein and hence vary in how they metabolise certain drugs. Let’s now learn about the laboratory technique you’ll use – the polymerase chain reaction or PCR.
7 Getting into the laboratory
Getting into the laboratory — Polymerase chain reaction (PCR)
For this investigation, we will be using a laboratory technique called the polymerase chain reaction (PCR). This technique greatly amplifies short segments of DNA by making many copies of it. This is done in vitro (outside the organism, in an artificial environment such as a laboratory).
The method exploits a key feature of the DNA double helix: each base makes a specific pairing with a corresponding base in the other strand. These interactions are known as base-pairing, for which there are very precise rules:
- T pairs only with A
- C pairs only with G.
Since the sequence of bases on one strand is complementary to the sequence of bases on the other strand, the two strands of the double helix are described as complementary.
DNA base-pairing provides a mechanism by which the DNA is normally copied within a cell. Once the strands have been separated, new DNA strands can be synthesised by an enzyme called a DNA polymerase. This adds nucleotides to each separated strand according to the base-pairing rules.
Any section of a person’s genomic DNA, such as the CYP2D6 gene, can be amplified using this copying process by using PCR. The process is rather like DNA replication, in that each strand of the duplex (double-stranded DNA) is copied, the duplex split apart and the copying repeated over and over again. This is performed in a laboratory environment using an enzyme called Taq polymerase.
Activity
Watch the video illustrating how PCR works.
http://www.dnalc.org/ resources/ 3d/ 19-polymerase-chain-reaction.html. (Please note this link takes you to an external website where a transcript of the video is also available. You may wish to open the video in a new tab.)
How many copies can be produced from a single starting molecule, according to the video commentary?
Answer
As many as a billion copies.
8 Thermal Cycling
To amplify just a particular segment of DNA the following steps are followed which requires a process of cycling between different temperatures - thermal cycling:
- The hydrogen bonds of the double strand are broken apart by heating the sample to over 94°C. This means that the bases are now exposed and available to pair with their complementary bases that are present in the solution as nucleotides.
- The short primer DNA chains bind or anneal to their target sequence on the DNA strand as determined by the order of complementary bases in them. This is achieved by cooling to a specific temperature. A short primer DNA molecule of only 18–20 bases in length will stick to only one site in the entire human genome. It is often said this is ‘finding the needle in the haystack’.
- As the Taq polymerase starts to add nucleotides to the end of each primer it does so using base-pairing rules so that each new strand is an exact complementary strand. This is achieved by heating the reaction to 72°C.
- When the completed double strands are heated again to separate them into single-stranded chains, each strand has the target site for the other primer in it. Hence, with each round of synthesis the number of copies of the region increases.
The number of copies of DNA grows exponentially with each cycle – after one cycle there are two copies, after two cycles there are four copies and so on. After just 30 cycles there will be 230 or over a billion copies. A ‘haystack’ has been created from the ‘needle’.
9 The PCR machine
The PCR cycle of heating to denature, cooling to anneal and then heating again to extend with Taq polymerase is carried out using a programmable machine called a thermal cycler or PCR machine (Figure 5). The PCR machine shown in Figure 5 can also quantify the newly synthesised double-stranded DNA made during each cycle.
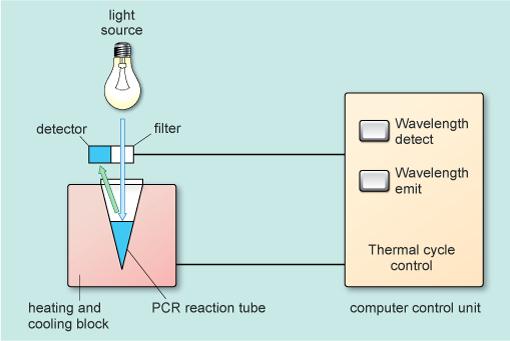
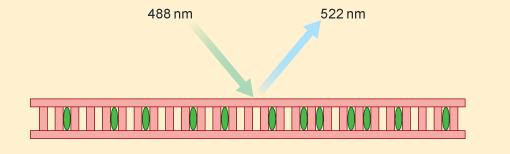
As the number of copies of the amplified region of DNA increases in the reaction tube it is possible to directly measure the DNA being synthesised by the use of special dyes which become incorporated into any double helical DNA molecules present. The PCR machine uses a beam of light of a known wavelength (488 nm, blue light, Figure 6) which is absorbed by the molecules of dye. The dye molecules then release both a small amount of heat and emit light of a different wavelength (522 nm, green light, Figure 6). This is called fluorescence. This emitted light is detected and easily measured. The amount of light emitted is therefore directly related to the amount of double stranded DNA that is present in the tube which increases with each cycle of the PCR.
In the laboratory, setting up a PCR reaction involves combining special reagents in a clean environment to avoid any chance of contamination that could interfere with the data.
10 How many copies of a gene
So how do we know how many copies of a gene we had at the start?
Consider how the number of copies of DNA that is present in the initial reaction tube will influence how many copies of amplified DNA are present at each cycle of the reaction.
If you start at cycle 1 with 2 copies, then by 20 cycles there are just over 4 million copies.
How many copies would there at 20 cycles if you had started with 4 copies?
Answer
There would be twice as many, over 8 million, as you would have twice as many to start from and each stage duplicates each DNA molecule.
We can use this idea in PCR to work out the number of starting copies present. The PCR machine automatically records when any particular test sample crosses a threshold value of fluorescence (amount of green light) that is detected in a tube. This can then be compared with positive control samples that have known copy numbers of the CYP2D6 gene or of particular variants. In this way we can work out how many copies of the CYP2D6 gene are present in that individual’s genome.
In order to make this comparison we need to ensure that every sample that is analysed contains the same amount of genomic DNA (and hence the same number of copies of chromosome 22 carrying the CYP2D6 gene).
11 And now for our genetic tests
There are many hundreds of possible DNA variants in the gene. The reagents available in this PCR laboratory test for the CYP2D6*4 variant and test for gene copy number.
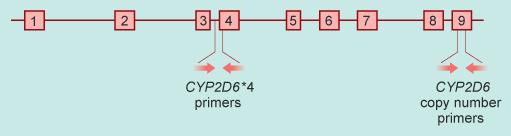
The location of each primer pair for the two genetic tests you will be performing is shown in Figure 7. The region containing the *4 variant (as was detailed in Figure 4), is amplified using one pair of primers (Figure 7, left of exon 4, running into exon 4). This test amplifies the presence of the CYP2D6 *4 only. The overall CYP2D6 gene copy number is detected using a pair of primers located in exon 9 (Figure 7, right). This test amplifies all variants of the gene, acting solely to indicate the gene copy number but providing no information about whether any particular DNA variant is present.
12 Interpreting the data you’ll get
For each of these PCR primer pairs, the PCR reaction is performed by selecting a program in the PCR machine that instructs it to cycle progressively through stages of denaturation (94°C), annealing at a temperature specific for each primer and extension (72°C). As the target DNA is amplified, the numbers of copies increases until it can be detected by the sensors in the machine. At this stage the machine automatically records the fluorescence at each cycle and plots the value on a graph.
On the PCR interface you will be using, this graph appears in the bottom left hand side of the window. In the example shown in Figure 8, you can see the recorded fluorescence for three samples that have undergone analysis for CYP2D6 copy number. You can see that the amount of fluorescence in each sample increases rapidly until the reaction reaches a plateau and no increase is detected (about 30 cycles). At this end stage, the reaction components are used up and amplification stops.
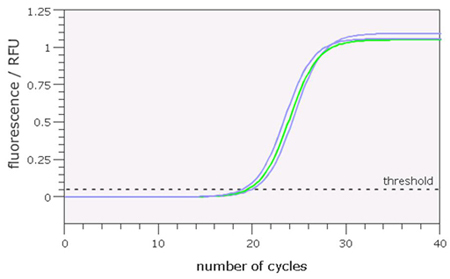
Note that for each sample, the time at which the fluorescent signal starts to increase rapidly is slightly different. The PCR machine detects this point and sets what is called a threshold. The point at which the level of fluorescence passes this threshold is called the Ct value, where C represents the ‘cycle’ number as shown on the horizontal axis. (Note that this value is a calculated value, so not necessarily a whole number).
The examples shown in Figure 8 represent the fluorescence curves detected during a PCR reaction performed on the same quantity of three genomic DNAs from individuals carrying 2, 3 or 4 copies of the CYP2D6 gene.
Of these curves, which is generated from the individual with 4 copies of CYP2D6?
(Hint: Consider the relative number of starting DNA molecules of the CYP2D6 gene and the copies amplified from each.)
Answer
The curve on the left represents the sample with 4 copies of the gene.
Samples with a higher starting number of target DNA sequences will increase more quickly and cross the threshold levels of fluorescence before those with lower copy number. Hence the lower the Ct value, the higher the number of starting molecules. As each reaction contained the same quantity of DNA, we can interpret the difference in Ct values as a difference in gene copy number. In Figure 8, it is possible to distinguish amplification profiles from an individual with 3 copies of the CYP2D6 gene (middle curve, green) from those with 2 or 4 copies (right and left, blue).
You will interpret the data from your PCR experiment in a similar way, in each case determining the CYP2D6 gene copy number and also how many of these copies are the CYP2D6 *4 variant.
13 Using control samples
In order to interpret the genotypes of each individual in the three populations, you will need to compare the experimental Ct values you obtain with those in control DNAs. Your control DNA samples are from individuals with known genetic sequences. These are individuals with different known combinations of variants and gene copy number on each of their two copies of chromosome 22.
Table 1, below, shows you the information you need for five control DNAs. It tells you how many gene copies each chromosome 22 has and whether they are the ‘normal’ CYP2D6*1 allele or the mutant CYP2D6 *4 allele which encodes a defective CYP2D6 protein.
These DNAs are positive controls for gene copy number as we know what their CYP2D6 gene copy number is expected to be. For the CYP2D6 *4 variant, however, only control DNAs 1 and 2 also serve as true positive controls as they contain that particular allele in a known copy number.
You will also use a negative control, a sample that contains only ultraclean water and no DNA. This controls for the presence of any contaminants in the reaction mix itself.
Table 1 The genotypes of the five control DNAs used in the PCR experiments. For each sample, the genetic make-up in terms of CYP2D6 gene copy number and which variant is present on each chromosome 22 is indicated.
| DNA | Gene copy number | Chromosome 22 CYP2D6 variant present | Chromosome 22 CYP2D6 variant present |
| Control DNA 1 | 2 | 2D6 *4 | 2D6 *1 |
| Control DNA 2 | 2 | 2D6 *4 | 2D6 *4 |
| Control DNA 3 | 2 | 2D6 *1 | 2D6 *1 |
| Control DNA 4 | 3 | 2 × [2D6 *1] | 2D6 *1 |
| Control DNA 5 | 4 | 2 × [2D6 *1] | 2 × [2D6 *1] |
14 So, let’s do the experiment!
In the PCR tests that you will be performing, you will be obtaining data on your control samples and on 90 biobank DNA samples.
- Go to the PCR laboratory and click on "Enter experiment" (open this link in a new window, so you can get back to the instructions easily, you may wish to sign up for this site)
- Read the ‘Welcome’ tab (you can ignore the link to ‘Instructions’ and instead follow the steps given here)
- Choose population A, click on ‘Start’ and then click on the ‘Master Mix’ tab
- Answer the following questions as you work through the onscreen instructions, being careful to choose the correct primer for the test you want to perform. The first test you should do is for the CYP2D6 *4 variant.
(Note that the word ‘aliquot’ just means to divide up into portions).
Identify the four components to be added to the master mix – what is the purpose of each?
Answer
PCR water – This is guaranteed free of any contaminating DNA.
Taq polymerase enzyme – This is a heat-tolerant DNA polymerase which bonds nucleotides to the ends of the primers, building the replicate DNA strands. It needs to be heat-tolerant because of the high temperatures used to separate the DNA strands at the beginning of each PCR cycle. (It comes from a species of bacterium that lives in hot springs.)
Nucleotide solution –This contains a supply of the four types of nucleotide that will be incorporated into the growing DNA strands by the Taq polymerase enzyme.
Reaction buffer – This provides the right conditions for the Taq polymerase to function efficiently. It also contains the light sensitive dye that fluoresces.
What is a primer and why do they come in pairs?
Answer
Primers are short chains of single-stranded DNA. They bind (anneal) to a specific target sequence of complementary bases on the DNA strands and so are able to ‘find’ a specific section of the DNA code.
The primer pairs have complementary bases. They are needed to bind to each of the complementary strands of DNA that are separated in the first heating step of the PCR cycle. The chains of new DNA that are made will include the target site for the other primer for the next copying cycle. This means that the number of strands doubles with each cycle leading to millions or billions of copies, so amplifying the specific target section of DNA.
There are two different pairs of primers used in this PCR laboratory which bind to different target sequences of DNA – one which contains the CYP2D6 *4 variant and one which belongs to all variants of the CYP2D6 gene.
- As you set up the PCR machine on the ‘PCR setup’ tab answer the following:
What is the heating block for?
Answer
This controls the temperature of the mixture in each tube. Each of the three steps in each PCR cycle requires a different temperature. This process of thermal cycling is computerised.
15 Experiment continued
- On the ‘PCR program’ tab select the correct PCR program for the test you want to perform and then click on ‘Start’
Look at the ‘Temperature profile’ window – why does the temperature change? What do the different temperatures do?
Answer
The temperature profile is showing the process of thermal cycling. Each PCR cycle consists of three steps and three different temperatures:
- Heating to 94 °C – The DNA strands are separated (denatured).
- Cooling to 64 °C or 60 °C – The primers bond to their target DNA sequences (the required temperature depends on the primer)
- Heating to 72 °C – The Taq polymerase adds nucleotides to the ends of each primer building new DNA strands.
Note that this process is significantly speeded up – a PCR run would take about an hour in real-time.
Look at the ‘Fluorescence output’ window – why does the fluorescence increase?
Answer
As the DNA is amplified then more light is emitted by the dye which is incorporated into its structure.
This emitted light (fluorescence) is measured by the PCR machine. It provides a direct measure of how much DNA is in each tube, which increases with each PCR cycle. (This increase tails off as the supply of nucleotides to build new DNA strands runs out.)
- When the program is complete the PCR machine automatically calculates the Ct values for each sample and deposits these data in the ‘Experimental Record’ window, alongside the record of each control and sample number.
- Click on ‘Clear All’ then click on Well F1 – the negative control.
What is the negative control in Well F1? Look at the ‘Fluorescence Output’ window and the ‘Experimental Record’ window. Is this the outcome you expect?
Answer
As this sample contains no genomic DNA, there should be no PCR amplification present. As amplification of DNA is detected by measuring fluorescence, you would predict that you should see no fluorescence.
- Click on ‘Clear All’ then click on Wells A1, B1, C1, D1 and E1 – the other controls.
Is the outcome as you’d expect for the other five controls? How do the Ct values for these compare? Table 1 may help.
Answer
For the CYP2D6 *4 primer pair you would predict that you would only see amplification in control DNAs 1 and 2. Control DNA 2 has a higher number of copies of the CYP2D6 *4 variant so you would expect the fluorescence to increase more quickly corresponding to the left-most curve. You would also predict that the Ct values for these would differ, with control DNA 2 having a lower Ct value.
- Click on ‘Clear All’ then click on Wells F5, G5 and H5 (Samples 32, 33 and 34)
Which curve in the ‘Fluorescence Output’ window corresponds to which of the three samples and why? Which sample has more copies of the CYP2D6 *4 variant?
Answer
Sample 34 has a lower Ct value than Sample 33. This means that the fluorescence in Sample 34 has reached the threshold value more quickly, corresponding to the left-most curve. Sample 34 must have started with more copies of the CYP2D6 *4 variant than Sample 33.
There is no fluorescence detected in Sample 32 so this corresponds to the horizontal line in the graph.
- Click on ‘Show All’, then highlight the data (headed ‘PCR experiment details’) and copy (Ctrl-C) then paste (Ctrl-V) into the spreadsheet template in the appropriate column, at row 4. (The application doesn’t save your data so this is an important step)
- Return to the ‘Welcome’ tab to repeat the program or choose a different population. Click on ‘Reset’.
- If you are doing this experiment in your classroom at school, your teacher will tell you which other population(s) you should study as well as which test(s) and how many replicates you should do.
- If you are doing this experiment on your own, do both tests for one of the populations A, B or C, performing two replicates for each.
16 Collected data
What do we do with the data we’ve collected?
You will be able to interpret your experimental data obtained for each of the biobank DNA samples 1-90 by using the Ct values for control DNAs 1-5.
- Look at the Ct values for control DNAs 1-5 and work out a range of Ct values that represent the copy number for each of the genetic tests. You can base your interpretation upon your own control Ct values and on data pooled from your fellow students.
- In your spreadsheet enter the number of copies for each sample in a new column (see below for more detail).
A column for each population has been provided, coloured orange.
For this you may find it useful to first fill in the number of copies for the controls (Column J) and the range of Ct values for each positive control (Column K), and, in the case of copy number, the range of Ct values for each copy number (Column N on ‘copy number data’ sheet).
- For CYP2D6 *4: for each sample look at the Ct value and decide whether it contains zero, 1 or 2 copies of the CYP2D6 *4 variant.
- For CYP2D6 copy number: for each sample look at the Ct values and decide whether it contains 2, 3 or 4 copies of the gene.
Are there samples for which you have any anomalous results or results that you cannot interpret based upon the control dataset you have? If so, what might you suggest about the genetic make-up of these samples?
Answer
For the copy number data you may have spotted that one sample shows ‘not detected’. This could be an error, but you will have found the same result when you repeat the experiment. This suggests that the sample has no copies of the CYP2D6 gene on either chromosome 22.
You may have noticed that some samples have higher Ct values than for the control with 2 copies of the gene. This suggests that amplification started from fewer copies of the target DNA sequence and therefore suggests that there is only 1 copy of the gene (and so one chromosome 22 has no copies).
- Use your data to draw a suitable graph/chart that shows the distribution of the CYP2D6 *4 and/or CYP2D6 copy number within the populations you studied and compares with the other populations.
Alternatively, the ‘results’ sheets in the template spreadsheet automatically count the frequencies from your orange data columns and draw bar charts using these frequencies.
Remember to check that your graphs really do correspond to the data – it is easy to make mistakes!
17 Genetic make-up
So what can we say about the genetic make-up of the individuals we tested?
In performing these PCR tests, there are some important aspects of human genetics that you will need to consider when interpreting your experimental data.
For each individual you have been able to determine:
- the overall copy number of the CYP2D6 gene present in individuals
- the number of CYP2D6*4 variant genes present.
Whilst this combination of data gives you some important information on those individuals, you must remember that you have only tested for two genetic variants.
For some individuals you do, in fact, have complete genetic data. For example, in individuals who carry two copies of CYP2D6, both of which are the *4 variant, you can confidently state that these individuals will not produce any CYP2D6 protein. In contrast, you will have identified some individuals with 3 or 4 copies of the CYP2D6 gene, none of which are the *4 variant. In this case, we do not, however, know whether each of their 3 or 4 genes are actually functional versions, or whether they carry other variants that inactivate the protein. In order to determine this, further testing is required to determine the DNA sequence of each of their CYP2D6 genes.
Once you have data for both CYP2D6 *4 and CYP2D6 copy number, look at the three samples you focussed on above (Samples 32, 33 and 34 in population A).
What can you say about the genotype for each individual? What can you say about that individual’s ability to metabolise prescription drugs that are processed by the CYP2D6 protein?
Answer
Sample 32 has no copies of the gene so this individual won’t produce any CYP2D6 protein and so won’t be able to metabolise certain prescription drugs.
Sample 34 has 2 copies of the gene, both of which are the CYP2D6 *4 variant. This individual won’t produce any functional CYP2D6 protein and so also won’t be able to metabolise certain prescription drugs.
Sample 33 has 2 copies of the gene, one of which is the CYP2D6 *4 variant. We don’t know whether the other copy is a functional version of the gene or whether it is another variant which produces faulty or no protein. We aren’t able to say whether this individual will be able to metabolise certain prescription drugs, but they would certainly have reduced ability compared to an individual with 2 or more functional copies of the gene.
Another thing that these tests don’t tell us is the make-up of each chromosome. For example a person with 2 copies of the gene, one of which is the *4 variant, might have 1 copy on each chromosome or they might have 2 copies on one chromosome and no copies on the other. So these tests can’t be used to answer questions about what genes that person might pass on.
18 Population differences
What about the differences between the populations?
Differences exist between world populations as to how frequent each of the 80 known variants of the CYP2D6 gene is. Although all modern humans have a common evolutionary origin in Africa over 100 000 years ago, migration across the globe has occurred since then. As migration occurred, breeding populations became relatively isolated from each other and over many thousands of years the relative frequency of the different variants present in each geographically distinct group around the world changed. This, together with the occurrence of random new mutations that generate new variants, means that different world populations carry different frequencies of CYP2D6 gene variants.
Individuals with three or more functional genes are called ultra-metabolisers. Numbers of these individuals vary from 40% (North Africa) and 26% (Oceania) to 12% (Middle East) and 8% (Americas). Individuals who are considered poor metabolisers are most common in populations of European decent, where as much as 8% of the population are of this status. One obvious implication is that a drug developed for one particular world market may prove potentially either useless or dangerous in other world populations.
19 How reliable is the data?
It’s always important to consider experimental uncertainties.
You will have seen some variability in the Ct values when repeating runs on the same samples. Can you think of any reasons for this?
Answer
There were various processes used before setting up a PCR reaction that might give rise to variability in the data such as measuring DNA concentrations and inaccuracies in using micropipettes.
Might these factors affect your data and might they therefore affect how it is interpreted?
Answer
It is very unlikely that the interpretation of the experimental values in these specific PCR tests would be affected by the inaccuracies introduced into the samples being tested. A particular DNA sample would have to have had half or double the amount of DNA added for any one result to have been influenced to the extent that you had obtained the incorrect estimate of gene copy number or *4 variant copy number. The inaccuracy introduced at various experimental stages leading up to the PCR reaction would not have introduced such a level of error.
20 To summarise
The human genome contains many gene variants that can, in some cases, lead to different amounts of functional CYP2D6 protein. This is also true for the many of the 20 000 protein-coding genes in the human genome. The relative frequency of genetic variants, however, differs between world populations, meaning that extrapolating the findings of genetic investigations from one population to another may not be appropriate.
We can use quantitative polymerase chain reaction as a sensitive analytical technique to detect gene variants and to determine gene copy number. There are limitations, however, to how data from single genetic tests are interpreted as other genetic variants might be present that have not been scored.
Experiment complete
If you have enrolled on this short course and worked through all the online materials for this experiment you are eligible for a Statement of Participation which you will receive via email.
If you are interested in other online Science experiments, visit the OpenScience Lab. You can also find many short free courses on Science on OpenLearn.
Acknowledgements
This course is an adapted extract from the Open University course S288 Practical science and was developed as part of the Opening Educational Practices in Scotland (OEPS) project funded by the Scottish Funding Council, which supports and builds best practice in open education in the Scottish HE, colleges and third sectors.
Course team
Amanda Law (Lead Contributor)
Dave Edwards (Lead Contributor)
Pete Cannell (Contributor)
Ronald Macintyre (Contributor)
Rosemarie McIlwhan (Contributor)
Anna Page (Contributor)
Tim Smith (Contributor)
Open University S288 course team (original authors)
Except for third party materials and otherwise stated in the acknowledgements section, this content is made available under a Creative Commons Attribution-NonCommercial-ShareAlike 4.0 Licence.
The images in this material are Proprietary and used under licence (not subject to Creative Commons Licence). Grateful acknowledgement is made to the S288 module team for permission to reproduce material in this unit.
Every effort has been made to contact copyright owners. If any have been inadvertently overlooked, the publishers will be pleased to make the necessary arrangements at the first opportunity.
Don't miss out:
1. Enjoyed this? Find out more about this topic or browse all our free course materials on OpenLearnand OpenLearn Create.
2. Join over 200,000 students, currently studying with The Open University.
3. Outside the UK? We have students in over a hundred countries studying online qualifications.