Use 'Print preview' to check the number of pages and printer settings.
Print functionality varies between browsers.
Printable page generated Saturday, 14 February 2026, 7:25 PM
Study Session 14 OWNP Planning and Budgeting
Introduction
Every project or programme has its own planning process and financial requirements. In Study Session 12 you learned about the source of funds for the full implementation of the OWNP, namely the government, NGOs and communities. In Study Session 13 you learned about the planned results for new and rehabilitated WASH facilities. In this study session we bring these facets together and you will learn about the processes of how activities are planned and the budgets estimated to enact the OWNP and achieve the intended results.
Learning Outcomes for Study Session 14
When you have studied this session, you should be able to:
14.1 Define and use correctly all of the key words printed in bold. (SAQ 14.1)
14.2 Describe the planning process of the OWNP and give examples of planned WASH improvements. (SAQs 14.2 and 14.3)
14.3 Outline the different types of plan used in the planning framework of the OWNP. (SAQ 14.4)
14.4 Summarise the overall costs and benefits of the OWNP. (SAQs 14.2, 14.3 and 14.5)
14.1 Introduction to planning
Planning is an essential activity for any organisation that wants to succeed and achieve its objectives. In spite of this, it is an aspect of management that is often neglected or performed in a less than adequate fashion. Planning is the systematic process of establishing a need and then working out the best way to meet it. It is a process through which we decide objectives and activities, with their sequences and resources.
Planning answers six basic questions about any intended activity:
- What? (the goal or goals)
- When? (the timeframe in which it will be accomplished)
- Where? (the place to implement the plan)
- Who? (which people will perform the tasks)
- How? (the specific steps or methods to reach the goals)
- How much? (resources necessary to reach the goals)
These questions were integral parts of the process that led up to the publication of the OWNP final document, which sets out the overall plans and budget for the Programme. These same principles are the basis of planning and budgeting for the implementation of the OWNP by all the different levels of administration. The next section explains the process that led to the formulation of the OWNP plans and budgets. Subsequent sections describe the continuing processes used to put the overall plans into practice.
14.2 OWNP planning process
The overall planning process of the OWNP involved two broad steps. First, the country's WASH status (before 2013) was assessed; service levels and problems were also identified. Then, goals were set to address the problems or increase service levels to reach the intended targets. The targets to be achieved, as you read in Study Session 2, had been set out in the Universal Access Plan (UAP) and the National Hygiene and Sanitation Strategic Action Plan (SAP). Box 14.1 reminds you of these important targets.
Box 14.1 Original targets for the OWNP
The Government of Ethiopia (GoE) set out its goals in the Growth and Transformation Plan (GTP). This identified water and sanitation as priority areas for achieving sustainable growth and poverty reduction. In line with the GTP, the GoE prepared the Universal Access Plan (UAP) with the following targets, which were adopted for the OWNP:
- 98.5% access to water supply (100% for urban populations and 98% for rural areas)
- reduction of the proportion of non-functioning water supply services to 10%
- 100% access to basic sanitation (improved and unimproved)
- 77% of the population to practise handwashing at critical times
- 77% of the population to practise safe water handling and water treatment in the home
- 80% of communities to achieve open defecation free (ODF) status.
The 98.5% target for water supply is derived from the average for all regions. In most regions the target is 100% but in Somali and Afar the regional water supply targets are 74% and 75% respectively. These lower figures reflect the challenges of providing water services in these pastoralist regions. The effect of these lower targets on the overall figure (only 1.5% less than 100%) is due to the relatively low population density in these two regions. The ultimate target is 100% for the entire country.
The Programme was divided into two phases over the full seven-year duration to allow review and adjustment at the end of 2015 when the GTP, UAP and Millennium Development Goals periods ended. It was foreseen that there could be changes in GoE policies, strategies and plans at that time, so the end of Phase 1 was timed to allow for these changes to be accommodated in Phase 2 of the Programme, which was originally planned for 2016–2020.
(It should be noted that the schedule has since changed. Full implementation of the Programme, which was planned for 2013, did not start until late 2014. This followed the endorsement of the Programme Operational Manual (POM) in September 2014 and the opening of the Consolidated WASH Account at MoFED to receive funds from donors.)
By comparing these targets with the situation at the outset, the size of the task could be defined and possible solutions identified. From Study Session 13, you know about the detailed targets for new and improved services that were itemised in the results framework. Once the number and scale of all the new services required had been identified, then cost estimates for each could be made, which added up to the total budget required for the Programme. OWNP planning used two complementary processes on which to base the estimates of work required and budget. The two processes were:
- Projections based on updated models used in preparing the Universal Access Plan (UAP) and Strategic Action Plan (SAP).
- A process based on information received from the regions and towns.
Budget estimates from these two processes were approximately the same and the figure of US$2.41 billion was taken as the overall OWNP planned budget.
14.2.1 Planning criteria
The targets in Box 14.1 were the overall goals for the Programme, but it also needed to specify how achievement of the targets should be assessed. For example, to measure progress towards the target of 98.5% access to water supply there needs to be a standard, or criterion, for what ‘access to water supply’ means. The criteria for water supply and sanitation for both rural and urban settings determined the number of water schemes and sanitation facilities to be constructed. For OWNP planning, the government used the standards for water and sanitation from the UAP and SAP, which were as follows:
- Rural water supply: 15 litres per capita per day within 1.5 km radius.
- Urban water supply: 20 litres per capita per day within 0.5 km radius.
- Rural and peri-urban sanitation: reduce open defecation by constructing both traditional and improved latrines using the community-led total sanitation and hygiene (CLTSH) approach (described in Study Session 10).
- Urban sanitation: sewerage will be considered in Addis Ababa, while desludging facilities and the provision of public toilets will be considered for other towns (OWNP, 2013).
Some of the terms used in these criteria may need explanation. Per capita is Latin and means per head or per person. Sewerage is the network of underground sewer pipes in a town or city. (Note this is not the same as sewage, which is the wastewater that flows through a sewer.) Urban areas without sewerage rely on pit latrines and septic tanks. These need to be desludged regularly, i.e. sludge that accumulates over time has to be removed. Desludging facilities include vacuum truck services and sludge drying beds. Vacuum trucks suck out the sludge from the pit or septic tank and take it away for disposal. Sludge drying beds are shallow tanks where sludge is left to dry out and can then be used as a soil improver.
Rewrite the criterion for rural water supply as a complete sentence using your own words.
The criterion for assessing if people in rural areas have access to water supply is that there should be sufficient quantity of water available to provide 15 litres for each person every day and the source of water must be within 1.5 km of their home.
The planners used these criteria and several other data inputs to calculate the number of facilities required and their costs. They needed to know the number of people living in an area and where they lived, the number of kebeles, the location of water sources or potential water sources and how much water they could provide, as well as sources and amounts of financial support. For budgeting purposes, they took account of regional factors such as the availability and costs of labour and materials, and also made a financial forecast of inflation. Plans and budgets were developed for all regions of Ethiopia and for each of the OWNP components. For water supply there are plans for new rural water schemes, for rehabilitating existing rural water schemes and for new urban water supply systems. For sanitation the plans cover combined rural and peri-urban areas, and urban areas. There are also plans for water supply and sanitation improvements in institutions. The OWNP document sets out the details of the facilities and costs for each of these components. The next section describes the plans for rural water supply in more detail. For full details of all the regional plans for all components of water and sanitation you should refer to the OWNP document.
14.3 Plans for rural water supply
Rural water supply plans in the OWNP are detailed and complex and clearly illustrate the size and scale of the Programme.
14.3.1 Rural water supply – new construction
Plans for new rural water schemes were developed using several different types and sources of data. In addition to the population and water source information mentioned above, they also considered the range of water supply technologies available, the number of people each could serve, and their service life (how many years each was expected to last). The type of scheme and number for each region depended on the size of geographical area, population and potential source of water. This complex process resulted in plans to create nearly 100,000 new rural water supply schemes across Ethiopia in order to achieve 100% access, of which more than 40,000 are self-supply schemes at household or community level.
Do you recall from Study Session 13, roughly how many of these planned new schemes for rural water supply are self-supply schemes?
According to the extract from the results framework in Table 13.1, more than 42,000 self-supply water facilities are planned.
The regional distribution and the range of different technologies to be constructed are shown in Table 14.1. Table 14.2 shows how many people were expected to benefit from each of the potential technologies considered. You can see illustrations of a few of these technologies in Figure 14.1.
| Region | Household-dug well with rope pump | Community-dug well with rope pump | Dug well with hand pump | Capped spring | Spring with piped system | Shallow borehole with hand pump | Shallow borehole with submersible pump | Deep borehole with piped scheme | Multi-village scheme | Rainwater harvesting | Cistern | Hafir dam | Total | |
| Tigray | – | – | 947 | 185 | – | 785 | 186 | 138 | 1 | – | – | – | 2242 | |
| Gambella | – | 101 | 268 | 87 | – | 237 | 6 | 4 | – | – | – | – | 702 | |
| B. Gumuz | – | – | 711 | 309 | – | 414 | 22 | 20 | – | – | – | – | 1,476 | |
| Dire Dawa | – | – | – | – | – | 32 | 5 | 3 | – | – | – | – | 41 | |
| Harari | – | – | – | – | – | 7 | 4 | 1 | 0 | 30 | – | – | 42 | |
| Somali | – | – | – | – | – | – | 35 | 88 | 2 | 244 | 1397 | 879 | 2645 | |
| Amhara | 7088 | 9479 | 8068 | 1724 | 17 | 2718 | 326 | 135 | – | – | – | – | 29,555 | |
| Afar | – | – | – | – | – | 267 | 27 | 51 | – | 475 | 670 | – | 1491 | |
| SNNPR | 1299 | 1955 | 4438 | 4588 | 143 | 2640 | 684 | 356 | – | 1467 | – | – | 17,571 | |
| Oromia | 8724 | 13,959 | 9785 | 5145 | 51 | 3681 | 805 | 479 | – | – | – | – | 42,628 | |
| Total | 17,034 | 25,495 | 24,217 | 12,037 | 211 | 10,781 | 2076 | 1275 | 4 | 2216 | 2067 | 879 | 98,393 |

| Type of scheme | Number of beneficiaries from each new scheme |
|---|---|
| Household-dug well with rope pump | 6 |
| Community-dug well with rope pump | 75 |
| Dug well with hand pump | 270 |
| Capped spring | 350 |
| Spring with piped system | 4000 |
| Shallow borehole with hand pump | 500 |
| Shallow borehole with submersible pump | 1500 |
| Deep borehole with piped scheme | 3500 |
| Multi-village scheme | 5000 |
| Rainwater harvesting | 100 |
| Cistern | 100 |
| Hafir dam | 500 |
| Other | 800 |
Based on the data in Tables 14.1 and 14.2, approximately how many people in the Harari region are expected to benefit from shallow boreholes with submersible pumps and how many from rainwater harvesting schemes?
In the Harari region, the estimates are that 4 shallow boreholes with submersible pumps will serve 4 × 1500 = 3000 people and 30 rainwater harvesting schemes will serve 30 × 100 = 3000 people.
14.3.2 Rural water supply - rehabilitation
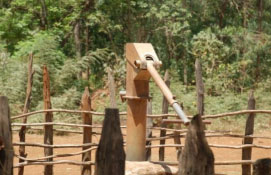
Rehabilitation means restoring a non-functional water scheme to an efficient working condition by repair or construction methods. The reasons for the non-functionality of water schemes include poor selection of site, poor design and construction, and poor operation systems. Figure 14.2 shows an example of a water scheme in need of rehabilitation. The OWNP plans to rehabilitate 20,010 non-functional water supply schemes in order to achieve the target of reducing non-functionality to 10% of the total number of schemes.
If a rural water scheme managed under the CMP approach becomes non-functional, who is responsible for repairing it?
As a community-managed project, the WASHCO would be responsible for maintaining and repairing the scheme in collaboration with the Woreda WASH Team.
14.3.3 Rural water supply – financial requirement
In the list of six planning questions that you read in Section 14.1, the last is ‘how much?’ Estimates for the financial requirement included programme management, study and design, post-construction support, capacity building, water quality monitoring, catchment management, and environmental safeguards were all determined, in addition to construction and rehabilitation of water supplies for households, schools and facilities. For rural water supply, the financial requirement was estimated at a total of more than US$ 1.13 billion.
14.4 Plans for other components
There are also physical and financial plans for urban water, rural and urban sanitation, and institutional WASH, which are summarised briefly below. (Some were also mentioned in Table 13.1.) Note that the OWNP financial requirements are estimated very precisely to the nearest dollar, but we have amended them here to give approximate figures in millions of dollars.
For urban water supply, activities are planned in 777 towns across the country to achieve 100% access during OWNP Phase I, which will require more than US$780 million.
Plans for improvements for institutions include the construction or rehabilitation of water supply facilities for 22,342 primary schools, 643 secondary schools and 7772 health centres/posts at an approximate cost of US$82 million and US$50 million respectively.
Sanitation improvements for institutions and communities include plans for some 36,712 facilities to be constructed or rehabilitated to meet OWNP targets, as shown in Table 14.3.
| Location | Type | Number |
|---|---|---|
| Schools | New | 6122 |
| Rehabilitated | 15,122 | |
| Health posts/centres | New | 7037 |
| Rehabilitated | 7141 | |
| Prisons | New | 350 |
| Rehabilitated | 342 | |
| Public latrines | Rehabilitated | 95 |
| Communal latrines | New | 95 |
| Rehabilitated | 408 | |
| Total | 36,712 | |
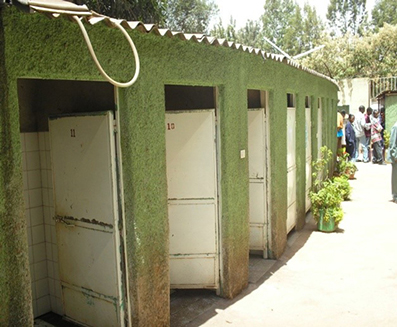
Public latrines (Figure 14.3) are open to anybody, in public places or in residential areas; typically there is a charge for each use. Users of public toilets generally feel less ‘ownership’ than users of communal latrines. Communal latrines are toilets shared by a group of households in a community. In some cases each household will have a key to one of the toilets within a block. This may be one toilet per household or one toilet for a group of households.
For rural and peri-urban sanitation, the estimated financial requirement is nearly US$400 million, of which approximately US$250 million is for hardware and construction activities and US$150 million for software activities.
The WASH club in a school arranged a health education session during break time to demonstrate handwashing. Is this software or hardware activity?
This is software activity because it focuses on knowledge, attitude and behaviour of people.
Urban sanitation activities consist of promoting on-site sanitation facilities by Health Extension Workers, the construction of public toilets, desludging equipment and drying beds. A total of US$96 million is required for desludging and public toilets in towns. More than 45% of this is for Addis Ababa alone.
14.5 Planning framework
Planning is not just a one-off activity in the OWNP. There is a continuous planning cycle in place to ensure the overall plans described in the previous sections are enacted. This planning activity takes place at all levels of the WASH management system, from federal down to kebele levels and involves all stakeholders. This activity follows a consistent framework that was established to harmonise the plans and budgets of all the implementing agencies into one plan and one budget.
There are a number of different types of plans included in the framework. This starts with Strategic Plans and Annual Plans at national, regional/zonal and woreda levels.
Strategic Plans comprise three elements in line with the planning process we have described above. Strategic Plans include the targets that are to be achieved, the baseline that states the current situation and resource mapping, which identifies the financial resources that are available (POM, 2014). To update strategic plans and ensure they continue to be relevant, the targets, baseline and resources are adjusted regularly to reflect the changing situation. For example, after two or three years of any ongoing project, some progress should have been made so the baseline would have changed, there may be more or less finance available, and the targets may need adjusting. A strategic plan should reflect these changes so it remains useful.
Once Strategic Plans are finalised, the next step is to prepare Annual WASH Plans. These translate the broader objectives and priorities of the Strategic Plan into practical activities and detailed budgets. Annual WASH Plans should be prepared in consultation with stakeholders including relevant government institutions, development partners, NGOs and, at woreda and kebele levels, the community. Both Strategic and Annual plans need to be reviewed and approved by the WASH Steering Committee at each level.
Annual WASH planning is done in two stages through the course of each year:
- Core Plans: includes physical and financial plans and provide the basis for building detailed Annual WASH Work Plans. Physical plans describe the work to be done and financial plans describe the costs and budget allocation.
- Annual WASH Work Plans: include specific details of activities, assignments, schedules and proposed expenditure from all sources.
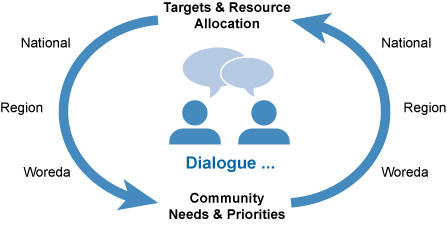
Do you remember the discussion in Study Session 7 about vertical relationships in the OWNP organisational structure? The planning process demonstrates these vertical relationships and involves a dialogue between implementers at different levels, both upwards and downwards. Core planning is essentially a top-down process in which higher levels set out their targets and allocations for the forthcoming planning period and hands them down to lower levels. Annual planning, on the other hand, should be bottom-up. Communities identify their needs, establish their priorities and plan their activities. As plans are consolidated at each level the implementers at the next higher level incorporate them in their plans and calculate what they need to do in terms of activity and budget expenditure to support the plans of the lower level (WIF, 2011). This process is illustrated in Figure 14.4.
The development of Core Plans and Annual Work Plans takes place in an annual cycle that follows the same pattern each year. Core planning takes place from August through to November and annual work planning from December to February. This is part of a much larger and more complex sequence of events in the annual planning and budgeting cycle that links the various levels according to the vertical relationships described above. Plans and budgets are consolidated at the different levels and submitted for review and approval. (You read about this process in Study Session 12.) Budgeting is tied in to the annual contributions from development partners that set the budget ceilings each year, the resource mapping exercise that confirms financial resources available from all possible sources, and the revised targets. In this way, the plans are revised every year so they correspond to the needs and priorities, and the available resources in order to make progress towards achieving the desired targets.
14.6 Overall costs and benefits of the OWNP
You read earlier that the total cost of the OWNP was estimated to be US$2.41 billion over the two phases of the Programme. The distribution of this total across the components is shown in Figure 14.5.

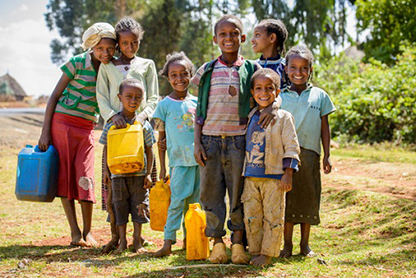
This massive investment will bring great benefits. Many millions of people will benefit from the programme and will have access to water and sanitation for the first time. A total of 26.6 million people in rural areas and 4.4 million people in urban areas are expected to benefit from OWNP water supply interventions alone. These changes will transform lives, especially for women and girls, and will be celebrated throughout the country (Figure 14.6).
Summary of Study Session 14
In Study Session 14, you have learned that:
- Planning of projects and programmes should ask six basic questions: ‘What?’, ‘When?’, ‘Where?’, ‘Who?’, ‘How?’ and ‘How much?’
- OWNP planning was governed by the goal of achieving WASH targets that had been set out in the Growth and Transformation Plan (GTP) and Universal Access Plan (UAP).
- Specific criteria were established for assessing when the water supply and sanitation targets were considered to be achieved.
- The planning process involved using data on the baseline conditions in all regions of Ethiopia and a complex range of assessments of population size and distribution, types of water supply scheme and their costs and benefits, etc.
- Planning outputs are detailed breakdowns of the number and costs of new and rehabilitated schemes required to achieve the targets.
- Planning of the OWNP is a continuous process that follows a specified schedule through the year and involves dialogue between all levels of the WASH organisational structure.
- The process includes Strategic Plans, Annual WASH Plans, Core Plans and Annual Work Plans.
- The total budget for the OWNP is US$2.41 billion and will have millions of beneficiaries in Ethiopia.
Self-Assessment Questions (SAQs) for Study Session 14
Now that you have completed this study session, you can assess how well you have achieved its Learning Outcomes by answering these questions.
SAQ 14.1 (tests Learning Outcome 14.1)
Complete the crossword below by answering the across and down clues.
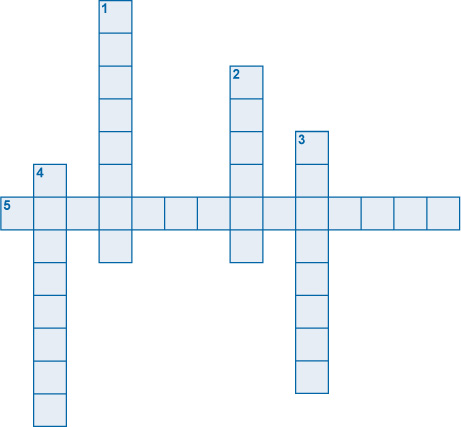
Across
5. Restoring a non-functional water scheme to an efficient working condition by repair or construction methods.
Down
1. Latrines that are shared by a group of households in a community.
2. Latrines that are open to anybody, in public places or in residential areas; typically with a charge for each use.
3. A process through which we decide objectives and activities, with their sequences and resources.
4. The network of underground sewer pipes in a town or city.
Answer

SAQ 14.2 (tests Learning Outcome 14.2)
Read the following paragraph and answer the questions below.
OWNP is the Programme of the Government of Ethiopia to achieve the targets stated in the GTP, i.e. 98.5% access for water supply and 100% for sanitation. It requires US$2.41 billion. The two phases for its full implementation originally planned were Phase 1 from 2013 to 2015, and Phase 2 from 2016 to 2020. Among the modalities to achieve the targets are CMP, WMP, NGO-managed project, self-supply, CLTSH and sanitation marketing. All WASH sector ministries and regional, zonal and woreda WASH bureaus and offices are responsible for the implementation of the Programme in all regions across the country.
- a.What is the goal of the Programme?
- b.What was the original schedule in which it will be accomplished?
- c.Where will the plan be implemented?
- d.Who will implement the Programme?
- e.What activities will contribute to reaching the goals?
- f.What is the financial resource allocated for reaching the goals?
Answer
- a.The goal is 98.5% access for water supply and 100% for sanitation.
- b.Phase 1 from 2013 to 2015 and Phase 2 from 2016 to 2020.
- c.Across the country.
- d.All WASH sector ministries and regional, zonal and woreda WASH bureaus and offices.
- e.CMP, WMP, NGO-managed project, self-supply, and CLTSH and sanitation marketing.
- f.US$2.41 billion.
SAQ 14.3 (tests Learning Outcome 14.2)
Based on the data in Tables 14.1 and 14.2, approximately how many people in Dire Dawa are expected to benefit from:
- shallow boreholes with submersible pumps?
- shallow boreholes with hand pumps?
- deep boreholes with piped schemes?
Why might it not be appropriate to add together these three figures to give a total number of beneficiaries?
Answer
In Dire Dawa region, the estimates are that:
- 32 shallow boreholes with submersible pumps will serve 32 × 1500 = 48,000 people
- 5 shallow boreholes with hand pumps will serve 5 × 500 = 2500 people
- 3 deep boreholes with a piped scheme will serve 3 × 3500 = 10,500 people.
The total number for these plans is 48,000 + 2500 + 10,500 = 61,000. However, some people could benefit from having access to more than one scheme and be in more than one group, so if you just add the totals together those people would be counted more than once.
SAQ 14.4 (tests Learning Outcome 14.3)
What are the key differences between the two OWNP stages of planning: Core Plans and Annual WASH Work Plans?
Answer
Core Plans includes physical and financial plans and oversight, providing the basis for building detailed Annual WASH Work Plans. Physical plans describe the work to be done and financial plans describe the costs and budget allocation.
Annual WASH Work Plans includes specific details of activities, assignments, schedules and proposed expenditure from all sources.
SAQ 14.5 (tests Learning Outcome 14.4)
Based on Figure 14.5, what are the relative proportions of OWNP budget allocation to water supply, to sanitation and to other components?
Answer
According to Figure 14.5, just under three-quarters of the budget is allocated to combined rural and urban water supply, just under a quarter to rural and urban sanitation and the remaining tenth (approximately) to programme management and capacity building.