Use 'Print preview' to check the number of pages and printer settings.
Print functionality varies between browsers.
Printable page generated Saturday, 4 July 2026, 12:32 AM
Study Session 2 Population Growth
Introduction
In Study Session 1 you learned about the major impacts of human activity on the environment. These impacts are inevitably linked to the number of people living on the Earth. Human population growth affects all people around the world through its impact on the economy, the environment, and the systems that support life. The population has grown rapidly over the past hundred years as a result of high birth rates and low death rates across the globe. Understanding population growth patterns and dynamics is important in helping to understand current and future trends in the use of the Earth’s resources and the impacts resulting from that use. For the water, sanitation and hygiene (WASH) sector, an increasing population means more demand for water to be used for domestic purposes as well as in agriculture and industry. It also means the production of more waste materials. Population growth is therefore a critical aspect of the context for improving WASH services.
In this study session you will learn about the causes of rapid population growth and demographic transitions; the changes in population size, its composition and characteristics; and the consequences of those changes on the environment, food security and health. We also briefly consider the link between poverty, population and the environment.
Learning Outcomes for Study Session 2
When you have studied this session, you should be able to:
2.1 Define and use correctly all of the key words printed in bold. (SAQ 2.1)
2.2 Describe the dynamics of population growth and demographic transition. (SAQ 2.2)
2.3 Describe population composition and characteristics. (SAQ 2.3)
2.4 Describe the impacts of population growth on food security and health. (SAQ 2.4)
2.5 Explain the interactions between poverty and the environment. (SAQ 2.5).
2.1 Trends and causes of population growth
Throughout human history the world’s population has been gradually growing. Figure 2.1 shows the trend from the year 1700. Growth is slow until the middle of the 20th century, when the gradient (slope) of the graph increases, indicating a change to more rapid population growth. The graph continues into the future to a predicted global population in 2050 in excess of 9 billion.
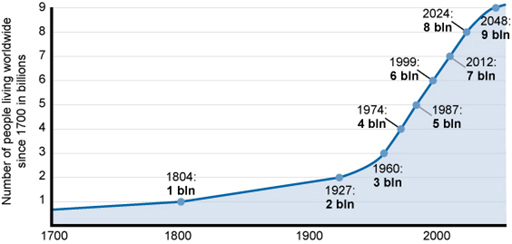
There are many factors that influence this trend. High rates of infant and childhood deaths and short lifespans put a limit on population growth in the past. However, improvements in nutrition, water, medical care and other technological advances have contributed to a sharp decline in deaths while births continue to increase, resulting in population growth.
Population change is governed by the balance between birth rates and death rates.
- If the birth rate stays the same and the death rate decreases, then population numbers will grow.
- If the birth rate increases and the death rate stays the same, then population will also grow.
Look at Figure 2.1. How would you describe the predicted trend in world population for the middle of the 21st century?
For most of the 21st century, from 2000 to about 2040, the trend shows a steady increase. By the middle of the century, at the far-right side of the graph, the gradient of the line on the graph is less steep – it flattens out slightly – indicating the rate of increase is expected to slow down by that date.
The main causes of death are disease, famines, accidents and war. Underlying these direct causes are interrelated contributory factors such as poverty, availability of health care, education and other social and economic factors. Since the start of the 20th century, there has been a sharp decline in death rates and an increase in length of life due to changes in these factors, which has resulted in an ageing global population. In 1950, about 8% of the world’s population was above 60 years of age. In 2013, this proportion had increased to 12% and it is expected to reach 21% in 2050 (UNDESA, 2013).
The rates of change in population vary in different regions of the world and can be categorised into groups based on the socio-economic development status of different countries, as shown in Figure 2.2.
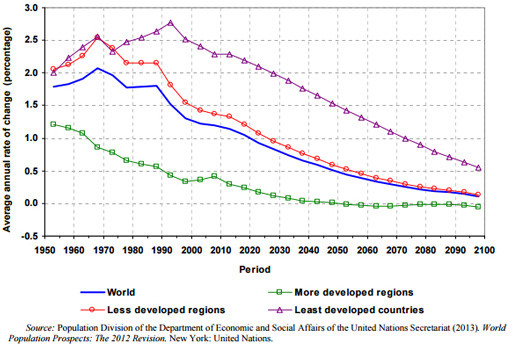
Does the trend in population change shown in Figure 2.2 correspond to the answer to the previous question about Figure 2.1 and the predicted trend for the middle of the 21st century?
Yes. Figure 2.2 shows a downward trend in the annual rate of change in all regions of the world for the remainder of this century. This corresponds to the slowing down of population increase shown in Figure 2.1.
- a.From Figure 2.2, which group is expected to have zero population growth by 2050?
- b.Which development group has the highest annual rate of population change?
- a.More developed regions are expected to have zero growth or, in other words, a static population level.
- b.Least developed countries contribute the highest annual population change for the world in the years between 1950 and 2100.
The least developed countries continue to have a higher rate of population increase for several reasons. Significant among these is the fact that the benefits from advances in health and agriculture are not spread evenly across the world. Medical technologies, for example vaccines and antibiotics, reduce the death rate by protecting people against diseases like influenza, measles, polio and rubella. However, vaccines are still not available for many diseases like malaria that are common in less developed countries, particularly in sub-Saharan Africa. Other public health measures, like water and sanitation, waste management and nutritional education are very important in preventing disease and in reducing the death rate. These measures are well developed in industrialised countries but less so in developing countries. Similarly, in agricultural science and technology, advances such as new kinds of seed, fertilisers, pesticides and mechanisation in farming have transformed food production. These have increased the quantity of food produced, which has helped to improve nutrition and decrease death rates. However, advanced food production and distribution are still developing in many countries.
2.2 Demographic transition
The changes in the population of countries over time have been found to follow a pattern described as ‘demographic transition’. Demographic transition is a process of fundamental change by which a country moves gradually from high birth and death rates to low birth and death rates. During the transition, death rates decline first and this is followed by a decline in birth rates. Figure 2.3 shows the five stages of demographic transition, described below.
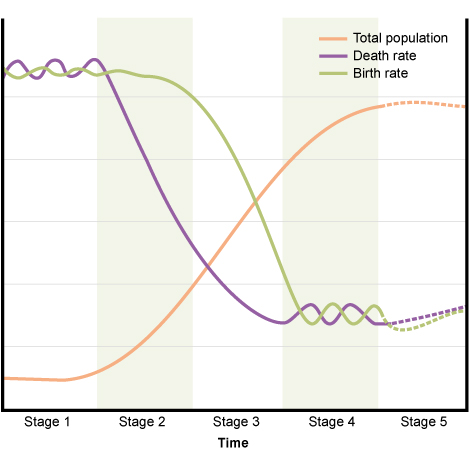
The stages are:
- Stage 1: High birth rates and death rates: This stage is characterised by high birth rates, high death rates and little population growth. Total population numbers are low and the high birth rate is balanced by the high death rate.
- Stage 2: Continued high birth rates, declining death rates: In this stage, there is a decline in the death rate. As the birth rate is still high, the result is population growth as there are more births than deaths.
- Stage 3: Falling birth rates and death rates, finally stabilising: Both birth rates and death rates are declining, but birth rates remain higher. Population growth continues due to the large numbers of people in the reproductive age group. Reproductive age group refers to all women aged 15-49 years. Death rates gradually level off and birth rates decline until eventually the population growth slows down.
- Stage 4: Death rates and population growth slows: The fourth stage is characterised by a fall in birth rate and a decline in the proportion of the population in the reproductive age group. These changes cause population growth to end and population size stabilises. The total population number is high, but the low birth rate and low death rate balance each other so that the population is no longer increasing. In this phase the birth rate falls to below replacement level. The replacement level is the number of births to each generation required to replace the generation before. You might think the replacement level would be two children per woman to replace the two parents, but in practice the level is slightly higher than this. The figure depends on several factors including fertility and mortality, and varies in different regions and countries. In developed regions it is usually taken to be about 2.1 children per woman but this figure is generally higher in less developed regions.
- Stage 5: Negative population growth: This stage occurs when slow population growth turns into a population decline after birth rates fall below the replacement level and, on average, women have fewer than two children in their lifetime. At this stage, the total population is high but it is going into decline due to an ageing population.
Countries throughout the world are currently at different stages of demographic transition. Some countries in Asia and Europe have low death rates, low birth rates and low population growth and are in stage 4. Most of the ‘least developed countries’ are still in stages 2 and 3. There are many causes that contribute to the changes of the demographic transition model and account for the variations seen between different countries. The main factors include:
- improved health and living conditions over time
- increase in age at time of marriage
- decrease in need or wish to have more children
- move from rural to urban living (urbanisation)
- increase in level of education, especially of girls and women
- increase in paid employment opportunities for women
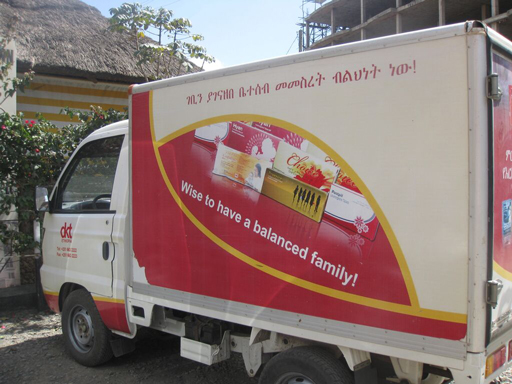
- increase in awareness and availability of contraception and family planning services (Figure 2.4).
How does an increase in marriage age and better awareness of family planning services affect population growth?
These would both lead to a decrease in the birth rate, which leads to a decrease in population growth.
Ethiopia is currently at stage 2 or 3 of the demographic transition. Looking at Figure 2.3 and the description of these stages in the text, what do you think this means for Ethiopia’s birth and death rates and for population growth in Ethiopia?
Both the birth rates and death rates are declining, but the birth rate remains much higher than the death rate, therefore the population continues to increase.
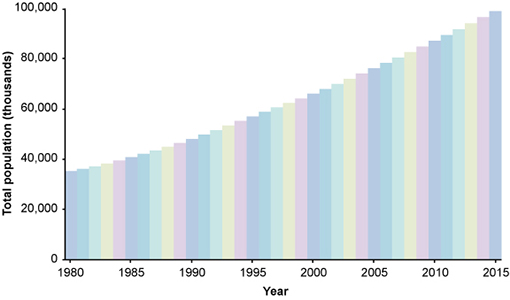
Figure 2.5 shows how Ethiopia’s total population has changed since 1980 and is heading towards 100 million.
2.3 Population composition and characteristics
Population composition is the description of the characteristics of a group of people in terms of factors such as their age, sex, marital status, education, occupation, and relationship to the head of household. Of these, the age and sex composition of any population are most widely used. The number and proportion of males and females in each age group have considerable impact on the population’s current and future social and economic situation.
2.3.1 Age
The age structure of a population is one of the basic demographic characteristics and is helpful for demographic analysis and for socio-economic development planning. Generally, less developed countries have young populations, while more developed countries have old or ageing populations (Population Reference Bureau, 2011). The relative numbers of different age groups have a significant impact on social and economic policies and on the way people live their lives.
The age dependency ratio is the ratio of the number of people in dependent age groups compared to the economically productive age groups. Dependent age groups are the young (aged under 15) and the old (over 65). People aged from 15 to 64 are classed as economically productive. The age dependency ratio is often used as an indicator of the economic burden of the countries. In countries with high age dependency ratios there is a large number of elderly and young people who are dependent on the economic productivity of the people in the middle age group. The large proportion of children in the population means countries with very high birth rates have the highest age dependency ratios.
2.3.2 Sex ratio
The sex ratio is the ratio of males to females in a given population, usually expressed as the number of males for every 100 females. Sex ratios may vary due to different patterns of death and migration for males and females within the population. For example, males are more vulnerable to wars and more likely to be mobile and migrate to other regions or countries, which would affect the sex ratio within the population, especially for young adult males.
2.3.3 Population pyramid
Both key variables of age and sex are combined in the population pyramid. A population pyramid is a graph which displays a population’s age and sex composition. The numbers or proportions of males and females in each five-year age group are represented using horizontal bars. Population pyramids of countries can differ markedly as a result of past and current patterns of birth rates, death rates and migration.
Figure 2.6(a) shows the population pyramid for Ethiopia and, for comparison, Figure 2.6(b) gives the data for Japan. The shape of the Ethiopian pyramid shows that there is a high birth rate and many more young people than old. The pyramid for Japan shows an ageing population with the majority of the people aged between about 30 and 70. There are also significant numbers of people, especially women, over 90 in Japan, indicating longer life expectancy.
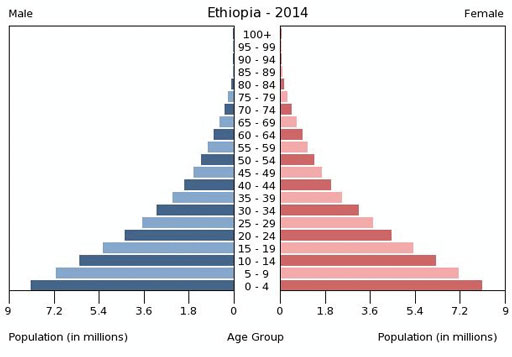
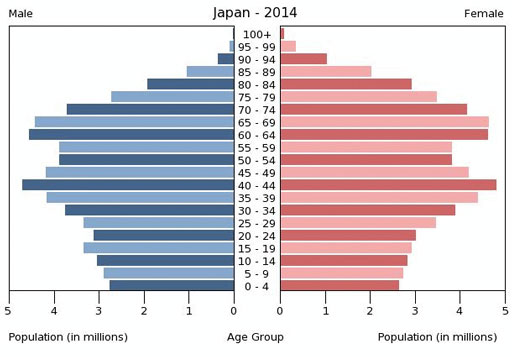
Look at Figure 2.6(a) and (b) and consider the three age groups used to calculate the age dependency ratio. How would the differences in the two pyramids affect the age dependency ratios for Ethiopia and Japan? (Hint: You do not have to calculate the ratio, just describe the differences.)
In Ethiopia there are many more people aged under 15 compared to the economically productive group, but few aged over 65. In Japan, there are more in the middle, productive, age group and a smaller proportion of children but also many more dependent older people. If this trend continues, in a few decades’ time there will be an even greater proportion of dependent elderly people in Japan compared to the economically productive middle group.
2.4 Impacts of population growth
As noted in Study Session 1, an increase in the number of people on Earth will mean that the impacts of their activities will increase too. However, it is important to note that this is not a simple cause and effect relationship. High population growth may deplete resources and trigger social or economic problems, but these same problems may also contribute to the causes of high population growth.
The impacts of population numbers on water resources and sanitation are covered in other study sessions. In this section we will look at the links between rapid population growth and problems with food, health and poverty.
2.4.1 Population growth and food security
As the population grows, the amount of food required to adequately feed people is increasing. Food security exists when all people at all times have physical and economic access to adequate, safe and nutritious food that meets their dietary needs for an active and healthy life (WHO, n.d.). In many developing countries, the numbers of hungry, malnourished people who don’t have food security are growing.
In Africa, agricultural production is increasing, but it is still lagging behind population growth. This means that even though the proportion of the population with inadequate food is decreasing, the total number of people is increasing. Graff and Bremner (2014) reported that between 1992 and 2010, the proportion of underweight children in sub-Saharan Africa decreased from 27% to 22% of all children, but the number increased from 24.8 million to 30.3 million.
One of the long-term consequences of malnutrition in children is stunting, which means children are not the height expected for their age. Stunting also affects child development and health, with the result that stunted children are less successful at school and are more vulnerable to anaemia, diarrhoea and some other diseases. In Ethiopia, more than two out of five children are stunted and 67% of the adult population suffered from stunting as children (World Food Programme, 2013). However, recent reports indicate the trend is positive and stunting has reduced in the past decade (Mideksa, 2015).
Food security can be improved by increasing the quantity and quality of food produced. This could be by bringing more land into cultivation or by improving crop yields by irrigation or the use of fertilisers. However, these ‘solutions’ to the problem will all have environmental impacts that need to be weighed up against the potential benefits.
2.4.2 Population growth and health
Population growth has a number of effects on health. Rapid population growth increases demand for health services, infrastructure, and financial resources. For a rapidly growing population, a shortage of health workers and resources causes difficulties in accessing health care services.
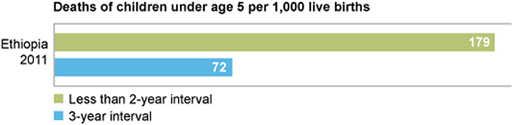
The number and spacing of children per family both have significant effects on health. Women who have many children are more likely to become ill than those with small families. Furthermore, the gap between children has a significant effect on the survival rate of the child. Figure 2.7 shows the difference in child survival for children born less than two years apart compared to a three-year interval.
The health implications of population growth are closely linked to poverty, which is the subject of the next section.
2.5 Poverty, population and the environment
Families with many children are more likely to live in poverty with an inadequate diet and poor living conditions. This leads to ill health, which diminishes people’s ability to work and puts them deeper into poverty in a negative downward spiral.
The environment is very important for the well-being of everyone, but particularly poor people because they tend to have a closer relationship with their immediate surroundings than people who are better off. Poor people are more directly dependent on the environment for food, water, fuel and traditional medicines, as well as deriving their income from it through agriculture, forestry or fishery.
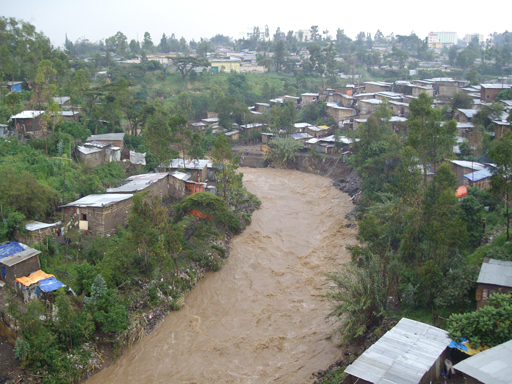
Poor people are also more vulnerable to natural disasters such as flood and drought, and to climate change. They may live in undesirable areas such as marshy lands without flood protection, or on unstable hillsides. Poverty means they don’t have the resources to build shelters that can withstand floods and landslides (Figure 2.8). In urban areas they are likely to live in slums with less access to affordable clean water, good sanitation or health facilities.
Poor people cannot afford to buy electricity to meet their energy needs, so they cut down trees for cooking, heating and other purposes. This adds to the problems of deforestation discussed in Study Session 1. Deforestation reduces the resources available from the forest and increases soil erosion and flooding, which in turn reduces productivity and damages crops, making poor people poorer.
For farmers, the lack of capital to invest in environmentally friendly technologies, coupled with constraints of land tenure, make it difficult for them to change their farming practices to safeguard the environment. A degraded environment significantly affects the health of poor communities, which impacts on their livelihoods, as they earn less and have to spend more money on health care.
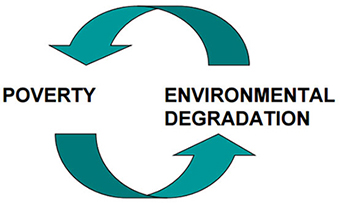
All of this adds up to the recognition that poverty leads to environmental degradation, which in turn increases poverty in a ‘vicious circle’ (Figure 2.9).
How can the vicious circle be broken? Three things have to be addressed. First, there should be investment to create job opportunities for poor people and increase their income. The government of Ethiopia’s Plan for Accelerated and Sustained Development to End Poverty (PASDEP) of 2006 was designed to lay out the programme for poverty eradication (MoFED, 2006). This has been carried forward with the Growth and Transformation Plans I and II.
Second, education can increase awareness and knowledge of environmental protection. Educated people are more likely to implement good farming practices, such as digging diversion ditches and terraces to prevent soil erosion, and follow proper waste management practices. Understanding the value of good hygiene practices can reduce waterborne diseases. This has an economic gain because better health means improved fitness, more income from work, and less expenditure on medicines.
Third, gender equality is another important way to break the vicious circle between poverty and environmental problems. Women, if they are empowered, will make informed decisions about the environment because they are in close contact with it when they collect wood, manage wastes and fetch water.
These three approaches have combined effects as well, and connect back to population growth. Educated women are more likely to be knowledgeable about contraception, and therefore to choose the size of their families. They will also be better placed to take advantage of new employment opportunities, as well as playing an important role in protecting the environment.
Summary of Study Session 2
In Study Session 2, you have learned that:
- The world’s population has grown rapidly since the mid-20th century and continues to increase. Improvements in health care, education and technology have all contributed to a sharp decline in the death rate.
- Births, deaths and migration are the main direct factors accountable for population change. Rates of change vary in different regions of the world. Population numbers are growing, but the rate of increase is declining throughout the world.
- Countries move gradually from high birth and high death rates to low birth and low death rates. This trend is called ‘demographic transition’.
- Age and sex are the important characteristics of a population. Developing countries have young populations, while developed countries have old populations. Because of the large proportion of children in the population, countries with very high birth rates usually have the highest age dependency ratios.
- Sex ratios may vary due to different patterns of death and migration for males and females within the population.
- Rapid population growth can put pressure on food supplies. It also increases the demand for health services.
- The consequences of population growth in terms of increasing demand for limited resources will have the greatest impact on poor people because poverty makes them more vulnerable and they do not have the money to change their situation.
- Environmental degradation increases poverty, which increases degradation in a vicious circle. Ways to break out of this circle include appropriate planning, education on ways to protect and restore the environment while improving incomes, and gender equality measures.
Self-Assessment Questions (SAQs) for Study Session 2
Now that you have completed this study session, you can assess how well you have achieved its Learning Outcomes by answering these questions.
SAQ 2.1 (tests Learning Outcome 2.1)
Rewrite the paragraph below using terms from the list provided to fill the gaps.
age dependency ratio, demographic transition, population composition, population pyramid, sex ratio.
Populations change over time as birth and death rates vary in a process called ……………… At any one time, the characteristics of the population of a country are described by its ……………… One of the factors typically included is the ………………, which compares the numbers of men and women. The other important ratio is the ……………… These two main population characteristics can be presented as a ………………
Answer
Populations change over time as birth and death rates vary in a process called demographic transition. At any one time, the characteristics of the population of a country are described by its population composition. One of the factors typically included is the sex ratio, which compares the numbers of men and women. The other important ratio is the age dependency ratio. These two main population characteristics can be presented as a population pyramid.
SAQ 2.2 (tests Learning Outcome 2.2)
Which of the following statements are false? In each case explain why it is incorrect.
- A.Advances in agricultural science and technology lead to changes in death rates.
- B.Falling birth and death rates are characteristic of stage 1 of demographic transition.
- C.Advances in public health measures are reducing the death rate.
- D.Processes for food production and distribution are the same throughout the world.
- E.The total population of a country increases to a maximum in stages 4 and 5 of demographic transition.
Answer
B is false. Falling birth and death rates are characteristic of stages 2 and 3, not stage 1.
D is also false. Processes for food production and distribution are not the same throughout the world; food production systems are generally more advanced in developed than in developing countries.
SAQ 2.3 (tests Learning Outcome 2.3)
Which of the following statements are false? In each case explain why it is incorrect.
- A.Developing countries have old populations, while developed countries have young populations.
- B.Sex ratios may vary due to different patterns of death and migration for males and females within the population. For example, males are more likely to migrate or to be killed in wars; both these factors would decrease the sex ratio within a population.
- C.The age dependency ratio can be used as an indicator of the economic burden of a country.
- D.The shape of the population pyramid of a country with a high age dependency ratio is always broader at the bottom than the top.
Answer
A is false. Developing countries have young populations while developed countries have old populations.
D is false. If the shape of the population pyramid is broader at the bottom this indicates a large number of young children; however, the age dependency ratio also depends on the number of people aged over 65.
SAQ 2.4 (tests Learning Outcome 2.4)
Briefly explain the relationship between population growth, food security and health.
Answer
Population growth means that more people will require sufficient food to meet their dietary needs. Food security can be improved by increasing the quantity of food produced by changing agricultural practices such as use of fertilisers or growing different crops. However, any improvements to agricultural productivity have to match the rate of population growth if they are to make a difference to food security. Long-term malnutrition makes people more vulnerable to disease and causes stunting, which impairs child development.
SAQ 2.5 (tests Learning Outcome 2.5)
You are putting together a presentation on interactions between poverty and the environment for a class of high school students. List five points you plan to address in your presentation.
Answer
In your presentation you should have covered five of the following points:
- Poor people are more directly dependent on the environment for their food, water, fuel and medicines.
- The environment is the source of income for many poor people through sectors such as agriculture, forestry, fishery and tourism.
- Environmental problems such as flood and drought tend to have a bigger impact on poor people.
- As environment influences poverty, poverty also affects the environment. For example, cutting down trees for fuel leads to deforestation and soil erosion.
- Poor farmers tend to lack the education, resources and security in land ownership to invest in environmentally friendly technologies.
- Poverty leads to environmental degradation which reduces agricultural productivity and makes poor people poorer in a downward spiral.