Week 3: Everyday patterns and formulas
Use 'Print preview' to check the number of pages and printer settings.
Print functionality varies between browsers.
Printable page generated Wednesday, 15 July 2026, 3:54 AM
Week 3: Everyday patterns and formulas
Introduction
Introduction
Patterns occur everywhere in art, nature, science and especially mathematics. Being able to recognise, describe and use these patterns is an important skill to have when tackling a variety of different problems and in understanding the world, for example, predicting the effect on fish numbers for a given amount harvested from the sea. This course explores some of these patterns, ranging from ancient number patterns to the latest mathematical research. It also looks at useful practical applications that are relevant to everyday life. Your study of this subject is spread over two weeks, and includes plenty of activities for you to do to gain confidence with these ideas.
In the following video Maria introduces you to Week 3:
Transcript
After studying this unit, you should be able to:
- recognise patterns in a variety of different situations
- use word formulas to help solve a problem
- write your own word formulas to help solve a problem.
1 Exploring patterns and processes
Patterns occur in many different ways in everyday life. They include how petals are arranged on a flower and the repeating notes of bird song. These patterns give us a powerful tool in understanding the world and universe. Many centuries ago ancient civilisations recognised the yearly pattern of changing sunset and sunrise and used this to build places of worship, such as Stonehenge in the UK. Today, patterns in the progress of the sun and moon are used to work out accurate heights and times of tides. This course does not look at anything so complicated, but this example does show that patterns are important in many different ways.
The first section starts by looking at a do it yourself (DIY) problem using tiles. See how you get on with describing the pattern in this first activity.
Activity 1 Tile pattern
Suppose that somebody is tiling a bathroom, and the last row of square tiles is going to be a decorative border made up of blank tiles and patterned tiles, as shown in Figure 1 below:

A friend has offered to help with the job. How would you describe the pattern so that they laid the tiles correctly? Click on ‘reveal comment’ if you would like a hint.
Comment
There is no one correct answer to how to tackle this description, so just get stuck in! Think about what might be the best way to describe this to somebody who didn’t have the pattern in front of them.
Answer
There are lots of ways you could have tackled this. For example, you might say that you will need some blank tiles and some patterned tiles with the ‘bridges’ on. Start with a bridge tile, and then put a blank tile next to it. Take another bridge tile, but turn it around so that the bridge is upside down, like a smile, and put it next to the blank tile in the same line. Then put another blank tile next to the smile tile. This is the pattern: bridge, blank, smile, blank, bridge, blank, smile …
Or maybe you numbered the tiles, something like this:
- bridge
- blank
- smile
The pattern would then be:
1,2,3,2,1,2,3,2 etc.
The decorative border is an example of a type of geometric pattern that has many applications in art, crafts and design. You may have something similar in your own home. If you have, see if you can describe this as some extra practice.
The next section looks at a number pattern that has fascinated people for many centuries.
1.1 Pascal’s triangle
Numbering the tiles in Activity 1 gave a number pattern that described a geometric pattern. This next example is a number pattern that appeared in China and Persia more than 700 years ago, but is still used by students in mathematical and statistical problems today – it even appears in chemistry. It is known as ‘Pascal’s triangle’ after the French mathematician Blaise Pascal who studied the properties of this triangle. The first part of Pascal’s triangle is shown in Figure 2:
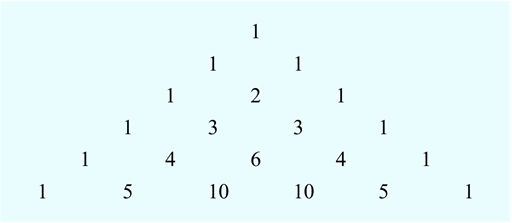
You can continue the triangle indefinitely by following the pattern. So how is it created?
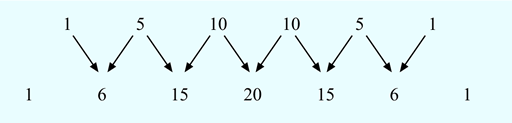
If you look at the triangle you can see that each row of numbers starts and ends with the number 1. Now look at the numbers in the second to last line (1 4 6 4 1) and the last line of the triangle. Look carefully at them both - can you see a way that you can make the numbers in the last line from the line above? If you add each pair of numbers in the second to last line, this gives you numbers in the last line.
Starting from the left-hand side the pairs of numbers are 1 and 4, 4 and 6, 6 and 4, and 4 and 1. So:
This process, plus adding a 1 at end of the line, generates the next row of the triangle. Have a go at creating the next line for yourself in this next activity.
Activity 2 Pascal’s triangle – next line
Create the next line of Pascal’s triangle by adding the pairs of numbers in the last line. Remember to add the 1s to the end of the rows when you are done.
You can watch a larger version of Pascal’s triangle being built in this video:
Now you’ve seen how to build Pascal’s triangle by adding pairs of numbers it’s time to see if there are more patterns hiding in this number triangle in the next section.
1.2 Pascal’s triangle – a closer look
As well as the patterns within the triangle being interesting in their own right, they are used in maths and science. If you continue your study at university level in these areas you may well come across Pascal’s triangle and will already be prepared for its delights. Also, having a go at spotting the patterns now will give you a chance to practise your pattern-spotting skills and you may well be surprised by how many there are!
Activity 3 Identifying patterns
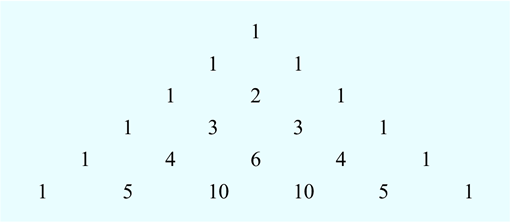
Study this six-row version of Pascal’s triangle and note down any patterns that you can spot.
Click on ‘reveal comment’ for tips on how to get started.
Comment
Play around with the numbers to find patterns. Try looking down the diagonals and adding the numbers in each row.
Answer
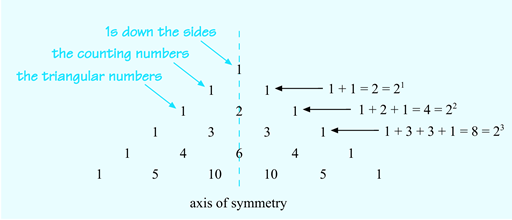
- Each row starts and ends with a 1.
- The counting numbers, 1, 2, 3, 4, 5, are in the diagonal rows next to the sides.
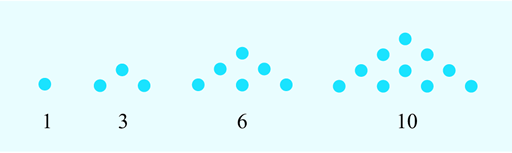
- In the next diagonal row, there is the sequence 1, 3, 6, 10. These numbers are known as the ‘triangular numbers’ because they create triangular patterns as shown in Figure 5:
- Pascal’s triangle is symmetrical, too. If you draw a vertical line down through 1, 2, 6, one side of the triangle is a mirror image of the other.
- The sums of the first six rows are 1, 2, 4, 8, 16, 32. The total for the next row is double the total for the current row.
These numbers can also be written as 1, 21, 22, 23, 24 and 25.
The pattern in the powers of 2 shown in Figure 6 suggests that the first total, 1, might be written as 20. Check on your calculator to see if this is correct. So it can also be said that the sums of each row are square numbers and these can be generated by raising 2 to the row number minus 1. Figure 6 may help you to see this more clearly than a written description:
Well done if you spotted some or all of those patterns. There are many more than those looked at here, so this is just a flavour of what can be found in Pascal’s triangle.
What do the two examples have to do with mathematics? Well, recognising patterns in shapes, sets of numbers, processes or problems, and noticing what is the same and what is different about situations, often makes a task easier to solve. You saw how recognising the tiling pattern in Activity 1 made it easier to remember and describe, and by using the number patterns in Pascal’s triangle, you could work out the sum of each row without adding the individual numbers.
If you can spot a pattern and then describe what happens in general, this can lead to a rule or formula. If you can prove that this rule will always work, it can be used elsewhere. For example, if you can work out the general process for calculating a quarterly electricity bill and then give these instructions to a computer, many electricity bills can be generated, printed and sent out in just a few minutes. It may also help you to understand your bill!
In the next section you will start to look at how this process of looking for relationships can be used to write rules.
2 Looking for relationships
This section considers the relationship between quantities in two practical situations and shows you how to describe these relationships by writing down a general rule or a word formula. You can think of these as a set of mathematical instructions. A good way to start is to use an everyday example.
Suppose you are planning a visit abroad. Your map marks all the distances between places in kilometres rather than miles, which you are used to dealing with. How can you work out what these distances are in miles? The first type of information you will need is how long one kilometre is, measured in miles. If you want to, you could use the internet to verify that 1 km is equivalent to approximately 0.6214 miles.
The next step is to work out how, using maths operations, you would convert kilometres into miles. You may be able to see how to convert from kilometres into miles immediately from your study of weeks 1 and 2 of this course – but, if not, try to visualise a few simple examples. The diagram in Figure 7 should help with this, as it shows how kilometres relate to miles:
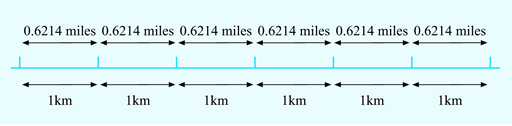
So if the distance is 3 km, you will have 0.6214 miles three times; if the distance is 10 km, you will have 0.6214 miles 10 times; if the distance is 250 km, you will have 0.6214 miles 250 times, and so on.
You can write this last example down mathematically as:
(to the nearest whole number)
Notice that in each of the examples above, the process for calculating the number of miles was the same: multiply the number of kilometres by 0.6214 (the conversion factor). This technique will work for any distance, and so the following word formula can be written:
Note that what the word formula works out is stated first – this is the standard way of presenting any formula.
You can use this formula to convert any distance in kilometres into miles. For example, suppose you wanted to convert 500 km, using the formula and replacing ‘distance in kilometres’ with 500 gives:
So 500 km, rounded to the nearest whole number, is equivalent to 311 miles.
In this example, you used the formula by replacing the phrase ‘distance in kilometres’ on the right side of the equation by the corresponding value, 500. This is known mathematically as substituting the value into the formula.
Have a go at this yourself in our next activity.
Activity 4 How many miles?
Using the word formula just worked out, calculate how far 350 km is in miles. Show your answer to the nearest mile.
Answer
Substituting 350 for ‘distance in km’ gives:
So, 350 km is approximately 217 miles to the nearest mile.
Now that you have used a word formula, you can move on to finding your own word formula in an activity with a similar idea behind it. Remember that drawing diagrams can help you with spotting relationships and patterns!
2.1 Finding a word formula
Instead of looking for a way to show the relationship between miles and kilometres in a word formula, the next activity asks you to find a word formula to help work out the value of one currency in another. This is very similar to the previous example, as the focus is again on how much of one quantity is represented by another. The activity takes you step-by-step through the process of writing your own word formula.
(Again, remember that drawing diagrams can help you to spot relationships and patterns)
Activity 5 Exchanging currencies
Suppose somebody is visiting Europe, and they want to exchange some money from pounds (£) into euros (€). One agency offered an exchange rate of £1.00 to €1.18 and did not make any additional charges.
- a.How many euros would you get for £5? How many euros would you get for £10?
Click on ‘reveal comment’ if you would like a hint to get going.
Comment
Try drawing yourself a diagram to help visualise what you have been asked to find.
Answer
a.For each pound, you would get €1.18.
So for two pounds, you get two lots of €1.18, and for three pounds, three lots of €1.18 and so on.
Similarly, if £10 were exchanged, the person would get 10 lots of €1.18.
- b.Now, write down a word formula that can be used to convert pounds into euros.
Answer
b.To change pounds into euros, multiply the number of pounds by the exchange rate of €1.18. The word formula to represent this is:
You may also have thought of the more general word formula that will work with any exchange rate of:
- c.Check that your formula works by using it to convert £5 into euros.
Answer
c.Substituting 5 for ‘number of pounds’ gives:
This agrees with the answer in part (a) as expected, giving confidence that the word formula is correct.
These examples illustrate how a word formula can be used to summarise a mathematical process such as converting units of length or currencies. Once a formula has been derived, it can then be used in other situations, both for calculations by hand or by computer – for example, for currency transactions in a bank. You will be able to practise writing your own formulas next week.
Now let's look at using formulas in some more real-life examples.
3 Real-life examples of using formulas
The previous section considered how a formula could be built and then how it could be used. This section considers some more complicated formulas that have already been developed and are used in a variety of different situations – such as cooking, health care, business and archaeology. These examples illustrate some of the broad applications of maths and how mathematical relationships can be used in making decisions. As you work through these examples, you might consider where else maths could be used in each of these topics.
When you are trying to solve a real-life problem mathematically, you often use formulas that have already been developed, so it is important to understand how to apply them. This section will help you do that.
3.1 Formulas in cooking
The time to cook a fresh chicken depends on its mass (commonly called weight in everyday language), as given by the following formula:
Roughly how long will a chicken with a mass of 2.2 kg take to cook?
To use the formula, you need to substitute the mass of the chicken into the right side of the formula and then work out the resulting calculation. However, the formula asks for the mass in grams, so the first step is to convert 2.2 kilograms (kg) into grams (g).
Since there are 1000 g in 1 kg,
Substituting 2200 for the ‘mass in grams’ in the formula gives:
Following the BEDMAS rules, the multiplication and division must be carried out first, which gives:
(If you are unsure about what BEDMAS is, you can find out more in Succeed with maths – part 1.)
So the cooking time would be about 125 minutes, or 2 hours and 5 minutes.
Now use the same formula for a different sized chicken in the next activity. Remember to check carefully what units of mass are required.
Activity 6 A smaller bird
How long would it take to cook a chicken with a mass of 1.6 kg?
Answer
First, convert 1.6 kg into grams, since the formula requires the mass in grams.
So,
Substituting this value into the formula gives:
The chicken would take about 95 minutes, or 1 hour and 35 minutes to cook.
The next example is an application from health care.
3.2 Formulas in health care
The body mass index (BMI) is sometimes used to help determine whether an adult is underweight or overweight. It is calculated as follows:
Although care needs to be taken in interpreting the results – for example, the formula isn’t appropriate for children, old people or those with a very muscular physique – a BMI of less than 20 suggests the person is underweight and a BMI of over 25 suggests the person is overweight.
In this formula, the units have been included in the expression on the right-hand side of the equals sign. It is important to change any measurements into these units before you substitute the values into the formula. (No units have been included for the BMI on the left-hand side, in line with current health care practice.) This is true for any formula that you will come across, so it is very important to remember.
This time, instead of giving you an example first it is straight into an activity to apply the formula.
Activity 7 Body mass index
If an adult man is 178 cm tall and weighs 84 kg, calculate his BMI and decide whether he is overweight.
Answer
The formula needs the mass in kg and the height in metres. You have the man’s height in centimetres, so this must first be converted into metres.
So, his
Substituting the mass and height into the formula for the BMI gives:
(to the nearest whole number)
Since his body mass index is over 25, the man is probably overweight.
Hopefully, you can see that this relatively simple formula gives any health care professional a way to check the health status of any patient.
The next section example introduces a bit more complexity in a formula, but all the same principles apply that you have already used. These are, converting to required units before substituting into a formula and following BEDMAS as necessary.
3.3 Formulas in business
One of the advantages of identifying the general features of a calculation and then describing it mathematically is that the formula can then be used in a computer to work out different calculations quickly and efficiently. Many utility suppliers (gas, water, electricity, telephone) have rates based on a fixed daily charge and a further charge based on how much you have used during the billing period.
For example, a mobile phone network charged £20 per month for 300 minutes (or less) of phone calls. Extra calls above the 300 minutes were charged at 40p per minute.
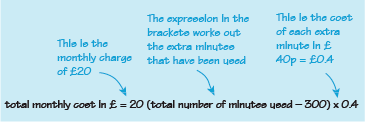
Assuming that more than 300 minutes were used per month, the formula for the total monthly cost can be expressed by the following word formula:
For simplicity data usage or texting are not included.
In this next activity you’ll unpick how this formula relates to the information given about the way in which bill is worked out. This insight will help when moving onto building your own formulas.
Activity 8 Understanding the formula
Suppose that in one month, 375 minutes of phone calls were made. Explain how you would calculate the cost for the extra minutes (above the 300 minute allowance) and then how to calculate the total cost for that month. Can you then explain how the formula has been put together?
Answer
Because 300 minutes are included in the £20 charge, the number of minutes that are charged separately is:
Each extra minute costs 40p. This is the same as saying £0.40 per minute, as . So 75 extra minutes will cost
So the total charge for that month is
The formula says that the fixed charge is £20, and then each minute in excess of the 300 minutes allowed costs 40p. How this information relates to our formula can be shown by including some extra notes with it, as shown in Figure 8:
Now you know how the formula works, and has been put together (or derived), try applying it in this next activity.
Activity 9 Mobile Phone bills
Use the formula to work out the total monthly cost for the following total number of minutes used:
- a.348 minutes
Answer
a.Substituting 348 for the total number of minutes gives the total cost in pounds as:
So, the bill for the month is £39.20.
Note how this calculation is set out with all the working and a concluding sentence that answers the question precisely. This follows the ideas for correct mathematical communication that were covered at the end of Week 8 in Succeed with Maths Part 1.
- b.250 minutes
Answer
- b.The formula only applies if more than 300 minutes of calls are made, so it cannot be used in this case. This is another important step in using formulas – check that they apply in your situation before using them. Here, the charge is £20 for up to 300 minutes of calls, so the charge for this month is £20.
If you have a mobile phone with a similar deal, you could work out a formula that fits yours and use it to check your bills – and get some more practice at the same time. It might also help you to decide if a different deal may suit you better.
Moving on now from everyday formula to those used in academic study, the next section looks at how one set of formulas are used in archaeology to work out the approximate height of some of our ancestors.
3.4 Formulas in archaeology
Footprints from prehistoric human civilisations around the world have been found preserved in either sand or volcanic ash. From these tracks, it is possible to measure the foot length and the length of the stride. These measurements can be used to estimate both the height of the person who made the footprint and also whether the person was walking or running. This can be done by using three formulas:
Note that no units have been included in these formulas – so it is important to make sure that you use the same units, such as centimetres, throughout the calculation.
The formula for relative stride length is used to establish if the person was walking or running. If the value of the relative stride length is less than 2, the person was probably walking; if the value is greater than 2.9, the person was probably running. Between these two values, it is difficult to be sure if the person was running or walking. The expected value for relative stride length is usually between 0 and 5.
Notice that the relative stride lengths quoted have no units. The stride length and the hip height are both measured in cm, and when one is divided by the other, these units cancel each other out, just like cancelling numbers when dealing with fractions. If you go on to study physics or other sciences, you will find many examples like this.
Before trying the next activity, if you would like to see one of these formulas being used in practice, have a look at this short video.
Activity 10 Footprints in the sand
From one set of footprints, the length of the foot is measured as 21.8 cm and the stride length as 104.6 cm. What does the data suggest about the height and the motion of the person who made these footprints? Remember you can click on ‘reveal comment’ if you get stuck.
Comment
Break the problem down into simpler parts. Start by asking yourself what you need to know to tell if the person was running or walking.
Answer
So,
(to the nearest cm).
To work out if the person was running or walking, it is important to know the relative stride length. This is given by:
The question gives the information about the stride length but not the hip height. To calculate the hip height use this formula.
Fortunately, this can be done, as the foot length is also given in the question.
So,
This has given all the information needed to calculate the relative stride length. So, substituting into the formula:
(rounded to 1 decimal place).
As the relative stride length is less than 2, the person was probably walking.
This was a slightly more complicated problem than our previous examples as it required a step in the middle to calculate some extra information needed. So, well done for having a go!
3.5 Combining formulas
There is a quicker way to the answer which requires two of the formula to be combined to give a new formula for relative stride length.
The formula for relative stride length was:
It is known that:
This means that it is possible to substitute the formula for hip height in the formula for relative stride length. This then gives:
This new formula could be used directly with the information that was given in the question. This version would also make more sense in the field, as it contains the two pieces of information that would be known on site.
In the final activity for this week you’ll consider why it is important to always think about whether the answer you have obtained looks sensible. This is something that you should always ask yourself. It can act as a prompt to check over your working or logic in any problem.
Activity 11 Relative stride length: what’s wrong?
A student used the formula to calculate the relative stride length in the footprints activity.
The student entered the key sequence on their calculator for the calculation as: 104.6 ÷ 4 × 21.8. This gave an answer of approximately 570, so the student concluded that the person was probably running very fast. Can you explain where the student made the mistake and why they should have been suspicious of their answer?
Answer
The calculator will perform this calculation from left to right, using the BEDMAS rules (order of operations), which treat multiplication and division as equally important. So, it will first divide 104.6 by 4 to get 26.15, and then multiply by 21.8 to get approximately 570. However, this is not the correct calculation from the formula.
The stride length (104.6) should be divided by (4 × foot length), so the calculation should be 104.6 ÷ (4 × 21.8). When explaining the formula at the start of this section you were told that the expected value for relative stride length lies between 0 and 5. So, an answer of 570 should have immediately set alarm bells ringing for this student that something had gone wrong somewhere. As well as checking your answer using known information, carrying out a quick estimate of what size of answer you are expecting can also be very useful. So, if you are expecting a value in the order of hundreds, say around 200, and your answer is in the millions, then those alarm bells should be ringing again!
Well done, you’ve just completed the last activity for Week 3! You’ve just got one final section to look at before moving on to the Week 3 quiz. This summarises the top tips for using any formula that you've covered here.
4 Tips for using a formula
The following tips for using any formula you come across will be useful, both in next week’s study and any further study at university level you may undertake, particularly if you are interested in maths, science or technology. You might find it useful to make a note of these now, or bookmark them to refer to later:
- Check that the formula can be applied to your particular problem.
- Check what values you need to substitute and also what units these should be measured in. Convert the measurements if necessary before substituting.
- Make a rough estimate for the answer.Substitute the values into the formula carefully.
- Use BEDMAS to work out the resulting calculation, step by step. Explain your steps carefully using words like ‘substituting’ and ‘converting’.
- Check that your answer seems reasonable, both practically and from the estimate. Round your answer appropriately.
Remember your concluding sentence should both answer the question and include units.
5 This week's quiz
Use the tips as you are completing the questions in this week’s quiz.
Go to:
Open the quiz in a new tab or window (by holding ctrl [or cmd on a Mac] when you click the link).
6 Summary
Congratulations for making it to the end of another week. You may not have realised it, but you have now started on groundwork that will lead you to taking your first steps with algebra. This is a fundamental tool of maths and is used in many different subject areas and other, possibly unexpected subjects. In fact anywhere you want to work out an unknown value from numbers that you already know will probably need some algebra. This is just the start of your journey though, and this course takes you through it step-by-step to help you build your confidence. What you should now feel more confident in doing is:
- recognising patterns in a variety of different situations
- using word formulas to help solve a problem
- writing your own word formulas to help solve a problem.
You can now go to Week 4.
Acknowledgements
This course was written by Hilary Holmes and Maria Townsend.
Except for third party materials and otherwise stated (see FAQs), this content is made available under a Creative Commons Attribution-NonCommercial-ShareAlike 4.0 Licence.
Every effort has been made to contact copyright owners. If any have been inadvertently overlooked, the publishers will be pleased to make the necessary arrangements at the first opportunity.
Don't miss out:
1. Join over 200,000 students, currently studying with The Open University – http://www.open.ac.uk/
2. Enjoyed this? Find out more about this topic or browse all our free course materials on OpenLearn – http://www.open.edu/ openlearn/ free-courses/
3. Outside the UK? We have students in over a hundred countries studying online qualifications – http://www.openuniversity.edu/ – including an MBA at our triple accredited Business School.