Week 2: The spectrum of personal investments
Use 'Print preview' to check the number of pages and printer settings.
Print functionality varies between browsers.
Printable page generated Tuesday, 28 July 2026, 3:58 AM
Week 2: The spectrum of personal investments
Introduction
The second week of Managing my investments explores the range of mainstream savings and investment products available to the personal investor. You’ll also examine new types of investments like peer-to-peer lending and crowd funding. Begin by watching the video, to hear Martin Upton introduce this week’s topics.

Transcript
The coverage of the spectrum of personal investments includes savings accounts, shares, bonds, property, commodities and investment funds. You’ll also examine new types of investments, like pensioner bonds and peer-to-peer and crowd lending.
The week also includes coverage of the costs associated with investing, including the fees that may be paid to investment managers, and the taxation of investment returns.
You’ll also look at the concept of the government bond yield curve and the importance of this yield curve to investment management.
By the end of the week you will understand the features and risks of the products available in the personal investment ‘supermarket’.
2.1 Variable rate and fixed rate savings products
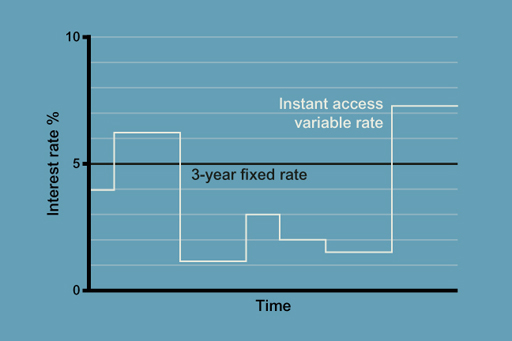
Begin by listening to the audio, in which a young professional, Ryan, asks for help from personal finance expert Jonquil Lowe in finding his way through the many savings products on offer.
You join their conversation as Ryan asks about a savings product he’s come across called a ‘term bond’. The other savings options that are described are trackers, variable rate accounts and notice accounts.
Transcript
You looked at the impact of price inflation on investment earnings in Week 1, when you examined real interest rates. Index linked accounts are attractive to investors who want to guarantee that their savings are inflation-proofed.
In the UK, only National Savings and Investments (NS&I) periodically offers an inflation-proofed savings product in the form of index-linked certificates. These certificates are, however, only available to current holders of such investments and not to new savers. Existing savers - some 500,000 - can renew their investments when their existing certificates reach their maturity by buying new NS&I index-linked certificates for terms usually of up to 5 years. The returns on these index-linked certificates are now linked to the Consumer Prices Index (CPI) inflation rate.
At times of low inflation, the return on index-linked investments can seem unattractive, but they come into their own in periods when inflation is expected to be high. Most savings products do not offer inflation-proofed returns.
2.1.1 Spot the highest Annual Equivalent Rate (AER)
Banks and building societies have to display the Annual Equivalent Rate (AER) offered by each product, to enable investors to make comparisons between savings accounts. The AER takes into account not only how much interest is paid, but also exactly when interest payments to account holders are made.
Activity 2.1 Annual Equivalent Rates
a.
Daily
b.
Weekly
c.
Monthly
d.
Yearly
e.
Quarterly
The correct answer is a.
Discussion
Well done. Daily is the correct answer. The more frequent the payment, the more compounding of interest there will be. Therefore, annual 5% interest paid weekly will have a higher AER than 5% paid monthly, which in turn will have a higher AER than 5% paid quarterly. The table here shows AERs for each period.
| Advertised rate | 5% | |
|---|---|---|
| Period rate | AER | |
| Daily | 0.0137% | 5.127% |
| Weekly | 0.0962% | 5.125% |
| Monthly | 0.1467% | 5.116% |
| Quarterly | 1.2500% | 5.095% |
| Annually | 5.0000% | 5.000% |
2.1.2 Savings accounts on offer

In the mid-2000s, there were major developments in ‘e-banking’ or online banking. Online savings (or ‘e-savings’) accounts can usually only be accessed online. With many accounts, the saver transfers money when needed from their online savings account into their current account electronically, which they can then access as they usually would. Some online accounts have a cash card, so money can be withdrawn via cash machines.
Interest rates are usually higher for ‘e-savings’ accounts because savers themselves manage the account. This reduces the costs to the bank or building society in terms of issuing a passbook or requiring branch availability to make transactions, however some institutions, although not all, require a current account to be held with them as well as the online savings account.
| Name of account | Interest tier | AER (gross p.a.) % |
|---|---|---|
|
Internet Savings An instant access online savings account |
£1+ | 1.25% |
|
Instant Access An instant access telephone savings account |
£1000+ | 1.35%* |
|
Notice Account A 120-day notice account |
£500+ | 1.60% |
|
5-Year Fixed Rate Bond (interest paid annually) |
£1000+ | 2.91% |
|
Instant Access Cash ISA A tax-free instant access account with cash card |
£1+ | 1.41% |
Footnotes
*Includes bonus in first year of 0.85% gross (0.68% net of tax at basic rate of 20%)Activity 2.2 Savings accounts
Every high street has multiple offers of different types of savings account from banks and building societies. Take a look at some of these in Table 2.2, and consider these two questions:
- What do you think are the key factors that explain why some accounts offer higher rates than others?
- Why would anyone want to take out an ‘Instant Access’ account?
2.1.3 Why savings rates differ
In Table 2.2 that you just looked at, the five-year Fixed Rate Bond and the Notice Account both have higher net rates than the Instant Access account. The amount saved also influences the rates offered for both Instant Access and Notice accounts: the higher the savings deposited, the higher the rate.
The Internet Savings account can offer higher rates due to the lower costs of managing the account. Despite this, some people will still choose the most basic Instant Access account, mainly because it provides plenty of flexibility, with instant access using a cash card, so that money can be accessed night or day. The downside is the lower interest rate on offers.
The ISA (Individual Savings Account) is not subject to tax so all savers get the full (or gross) amount of interest. To encourage saving, the annual limit, for each tax year, for investments in ISAs is £20,000 per person.
From April 2017 a new ISA product – ‘Lifetime ISAs (LISAs)’ – became available to those aged under 40 years. These ISAs allow tax-free savings of up to £4,000 per annum with the government topping up balances by £1 for every £4 saved. Lifetime ISAs, which can be built up until the age of 50 years, are intended to help people save for property purchase or to help provide income in retirement.
A new government savings scheme for those on low incomes also became available from September 2018 with those on in-work benefits who save £50 per month for up to 4 years getting a 50% (up to a maximum of £1200) top up from the government.
While this and the previous section focus on differentials between types of savings accounts, the general level of rates will be related to the Bank of England’s Bank Rate. If Bank Rate rises then, perhaps with a short delay, savings rates will normally rise too. A falling Bank Rate will normally result in falling savings rates.
The difference, or ‘margin’, between Bank Rate and the general level of savings rates is prone to variation though. The circumstances under which the margin is low are when banks and other financial institutions are not keenly seeking funds from savers. This can be where:
- The amount of new lending being undertaken by banks and other lenders is low – so creating only a limited need for funds to support this lending.
- Alternative sources of cheaper funding are available from the wholesale financial markets (other banks and institutions), with the result that savings from personal investors are not needed. In Week 1 you saw how the Funding-for-Lending Scheme provided such cheap funds to lending institutions from 2012 with the consequent adverse effect on the general level of savings rates for personal investors.
By contrast the margin over Bank Rate for the general level of savings rates will be high where:
- The amount of new lending being undertaken by lending institutions is high.
- There are limited alternative sources of funding, at reasonable rates of interest, to personal investors’ savings. This scenario applied during and immediately after the 2007/08 financial crisis when banks and other lenders had difficulties accessing reasonably priced funds from the wholesale markets.
2.1.4 Savings accounts – are there risks?
In this video, Simon Katte of the government’s Money Advice Service (MAS) talks about the risks arising from savings and investments.

Transcript
2.2 Investing in shares

In personal finance, the terms ‘savings’ and ‘investments’ have different meanings.
Savings accounts refer to any form of deposit account that pays interest on top of the amount deposited. The amount deposited is not at risk unless the institution defaults. Investments (which can include shares, bonds or investment funds that can hold these types of asset) also allow interest or dividends to be paid but, crucially, the investment itself can fall or rise in value – these products will warn you about this in the small print.
This means that it is not income alone that is relevant (as the rate of interest is on savings products) but the total return, which may be made up partly of income and partly of the change in the value of the capital. If the price of the investment goes up, a capital gain will be made, but if the price goes down, a capital loss is made.
With increased regulation of financial intermediaries and other financial firms, including the actual providers of savings and investment products and their company salespeople, and the requirement to explain fully the characteristics of the financial products they sell, mis-selling of financial products should, in theory, be unlikely, but it still happens.
Not everyone reads the small print on documents, or understands all the choices and all the products’ details, but the saying ‘the safest way to double your money is to fold it in half’ is perhaps a reminder that promises of high returns usually carry higher risks. This can be linked to a risk–return spectrum. Products with low risks tend to have lower returns, and those with higher risks have potentially higher returns, as you see in the graph.
Later this week and next week you explore investment funds, which represent the usual way that personal investors invest in the stock markets. You may think that investments are not relevant to you, but if you have pension savings or save regularly through a life insurance policy, then whether you know it or not, you are an investor! To understand the nature of these funds, you will first take a quick look at how shares and bonds work, since these are the fundamental building blocks of most funds and many other investments.
Before you move on, bear in mind that the definition of the difference between savings and investments being used in this course is not a universal one. In particular, some products that are advertised as being ‘long-term savings products’ may well involve shares or other forms of investment, and so their value can go down as well as up.
2.2.1 More on shares
| High (p) | Low (p) | Company | Price (p) | +/- | Yield (%) | P/E |
|---|---|---|---|---|---|---|
| 1336 | 726 | Dunelm | 1052 | +17 | 7.8 | 14.0 |
| 236 | 93 | Marks & Spencer | 225 | +4 | - | 12.2 |
| 7460 | 4306 | Next | 7036 | +136 | 2.9 | 12.3 |
| 291 | 169 | Sainsbury J. | 257 | +7 | 5.1 | 8.6 |
| 307 | 194 | Tesco | 280 | +6 | 3.9 | 27.9 |
Footnotes
Prices rounded to nearest penny (p)Footnotes
Unch = ‘unchanged’Footnotes
Where no dividend has been paid there is no measure for yieldShares are sometimes called ‘equities’. They entitle the holder to a share or part ownership in a company. Depending on the type of share, this may entitle the shareholder to vote on how the company is run. Shares also usually entitle their owners to receive dividends, paid by the company out of the profit it makes. The receipt of these dividends is, for the shareholder, the income element of the return from their investment in the shares.
Look at the table above showing some UK companies’ share prices. Below is an explanation of the information presented in the columns of the table. Take time to familiarise yourself with the key terms that are used when analysing the performance of a company’s shares.
- High: the highest price of share in a certain time period, for example over the last year.
- Low: the lowest price of share in a certain time period, for example over the last year.
- Company: the name of the company whose shares are shown in the table.
- Price: the current price of share, shown in pence.
- +/-: change in share price from the previous day.
- Yield: the dividend income per share after tax expressed as a percentage of the price of the share. High figures can suggest higher income from investments, but a high yield can also indicate that the company is not growing very fast or is quite risky.
- P/E: the ‘price/earnings ratio’ is the share price divided by the earnings per share. So, if the share price is 200 pence and the earnings per share are 5 pence the P/E ratio would be 40 (note that earnings are the company’s profits after tax, i.e. net profits). Investors are prepared to pay more for shares whose earnings they think are going to rise strongly, so demand pushes up the share price, which in turn increases the P/E ratio. The P/E ratio is often seen as a barometer of confidence in a company’s prospects.
Further analysis of the performance of a company’s shares can include:
- Tobin’s Q: the value the stock market puts on a company (measured as the market value of its shares and debts) divided by the estimated cost of replacing all the company’s assets. A value less than 1 suggests the company is undervalued.
- Dividend cover: earnings per share divided by the net dividend per share. A high figure suggests a secure company with strong profitability. A figure less than 1 is a sign that the dividend may be cut or even cancelled in the future.
- Dividend payout ratio: this equals 1/dividend cover.
The price at which a particular share can be bought or sold will vary from minute to minute depending on the balance of investors who want to buy them and existing holders who want to sell. If investors are able to sell shares at a higher price than they originally paid, they make a capital gain. If they sell for less, they make a capital loss.
Shares are bought through a stockbroker. A stockbroker can be found in high-street banks or through the internet, or through the The Personal Investment Management and Financial Advice Association (PIMFA). For online stockbroking, there may be a flat-rate charge for any transaction, say £12 for one-off trades, or £10 per trade for frequent traders. It is not usually worth buying or selling shares in very small amounts of less than a few hundred pounds. Conventional stockbrokers may also charge a percentage commission on the value of the transaction subject to a minimum commission. You will find out more about transactions costs later this week.
Stamp Duty Reserve Tax (SDRT) of 0.5% is paid when shares are bought electronically (which the vast majority are these days). SDRT is not paid when shares are sold. Share prices can be seen in most newspapers that report daily on share prices as well as on other information.
2.2.2 When do shares offer good value?
An investment in shares may be expected to produce a stream of payments, but remember there are some very important differences:
- shares do not have a redemption date
- the amount the investor gets back on sale depends on the market price at that time
- dividend payments are not contractual or guaranteed
- the amount of each dividend may vary.
This means that there are many possible outcomes, depending on how well the company performs, the proportion of its profits paid out in dividends to shareholders, and how the share price performs over the holding period.
Estimating the intrinsic value of shares is the essence of fundamental analysis . In a classic work on the subject, Graham and Dodd’s Security Analysis, the authors (Cottle et al., 1988) define the intrinsic value of a company as: ‘its economic value as a going concern, taking account of its characteristics, the nature of its business(es), and the investment environment’.
Fundamental analysis is an important technique, widely used by people working in the financial services industry. While some personal investors carry out their own analysis, more often they rely on reports and forecasts from stockbrokers, but some understanding of the techniques, ratios and measures used by analysts is necessary to interpret these reports.
2.2.3 Shares – more on when they are good value
A key task for analysts is to estimate a company’s future earnings and to give some idea of how confident they are that their forecasts will prove correct. There are various ways in which the analyst can work from the earnings forecasts to estimating the return from investing in the company’s shares. One is to assume the proportion of earnings that will be paid out as dividends (called the dividend payout ratio). This produces a stream of future dividend payments that can be discounted to produce the present value of the company’s shares.
The stream of payments must include an estimate of the price at which the shares will eventually be sold. But assuming that it matches the intrinsic value, that future sale price will itself reflect the present value of the future dividends to be paid to the new shareowner. Therefore, instead of trying to estimate the sale price directly, the present value of the shares can be assumed to equal a discounted stream of dividends that goes on being paid indefinitely. This is called the dividend valuation model. In its most basic form, the model assumes that dividends continue at their current level. Other forms of the model allow for dividends that increase over time either at a steady growth rate or at a reduced rate once an initial period of rapid growth has passed. These models cannot be used to value companies that have yet to start paying dividends – typically relatively new, high-growth firms.
Another commonly used bridge from the analyst’s earnings forecast to a share valuation is the price–earnings (P/E) ratio. This is the share price divided by the company’s yearly earnings per share. The resulting number can loosely be thought of as the number of years that it would take to recoup the price paid, but its main function is as a measure of relative value. For example, suppose that the analyst has forecast that earnings for a drug company will be 20 pence per share next year and the P/E ratio for the pharmaceuticals and biotechnology sector is 9.6. The analyst could estimate the intrinsic value of the company’s shares as 9.6 × 20p = 192p per share. The valuation can then be compared with the actual market price to assess whether the shares look cheap or overpriced. Once again, this technique cannot be used to value companies that have no earnings, since this makes it impossible to calculate a P/E ratio.
Investors more often start by looking at a company’s P/E ratio, then compare it with the ratios for similar companies or the relevant sector as a whole. A high P/E ratio may indicate investors’ expectations that a company’s earnings are set to rise significantly, but equally it could suggest that the shares are overpriced. Investors may also use dividend cover, Tobin’s Q and the dividend payout ratio (as discussed in Section 2.2.1) to analyse a company’s prospects.
Any one investor is comparing the value that he or she puts on a share with the price in the market, which from the individual’s point of view is a given amount determined externally and over which the investor normally has no influence. However, it is worth bearing in mind that the market price is set by the collective actions of all investors, so that the price can be seen as an average of all investors’ views about the value of the share.
2.2.4 Share valuation
This short quiz is a chance to quickly check what you know about share valuation.
Activity 2.3 What do you know about share valuation?
a.
2 pence
b.
450 pence
c.
45 pence
d.
0.5 pence
The correct answer is b.
Discussion
The ‘fair’ share price is 30 pence × 15.
a.
pre-tax profits divided by the total cost of dividends
b.
share price divided by earnings per share
c.
earnings per share divided by net dividend per share
d.
dividend income per share as a percentage of the share price.
The correct answer is c.
Discussion
The ratio shows how well placed a company is financially to pay its shareholders a dividend.
2.2.5 Shares to follow
Armed with what you have learned about shares and the factors affecting their valuation, it is now time to start tracking the prices of the shares of selected companies.
The selected companies are:
- Anglo American – the international mining company
- BP – the oil company with a global profile
- Marks and Spencer – the UK focused retailer with overseas activities
- Tesco – the UK supermarket company with a major presence in other countries
- Rank – the media company
- Rolls Royce – the UK engineering company specialising in aerospace
- Nat West Group (NWG) – previously known as Royal Bank of Scotland – the bank that is currently largely owned by the UK Government after its rescue in 2008 during the financial crisis
Activity 2.4 Tracking shares
This is an activity you should carry out in your own time, either as you work through the course or when you have completed it.
You just need to check the prices for the selected companies once a week and enter their level in the Market prices tracking worksheet. Do this every week for this and the next four weeks.
In later weeks, we’ll also ask you to monitor the prices of two UK government bonds – you learn more about these later this week. As you know, the Bank of England’s Monetary Policy Committee (MPC) sets the official rate of interest for the UK (also known as Bank Rate). The decisions are normally announced at 12 noon on the Thursday after the first Monday of each of the eight months it meets in each year. So while studying Managing My Investments you should monitor and record the level of Bank Rate and look out for the decisions of the MPC. In October 2023 the rate was 5.25%. The prevailing level of Bank Rate can be found on the Bank of England’s website or in the financial press.
You can track the prices and yields on UK government bonds (gilts) using the link provided later in this session in the section on ‘Gilts and the risk-free yield curve’. Alternatively, you could pick up a copy of the Financial Times.
Some of these companies may be reporting their latest financial figures while you are making your observations – so it will be interesting to see how the markets and their share prices react to their financial results. This can give us further evidence about the factors that drive share prices.
Two points to remember, though:
- At the same time that specific factors about their performance will be influencing the share prices of these companies, general factors affecting the equity markets as a whole will also be impacting. You looked at the generic drivers of equity markets, such as the pace of economic growth in the UK and other economies, in Week 1. So it is important to see how the share prices of our companies perform not just in absolute terms, but also relative to the market as a whole.
- As discussed earlier, the levels of share prices reflect the aggregate market view of the performance and prospects for companies. This is important when seeing how share prices react to the publication of financial results. Even if the results look, on the face of it, to be ‘good’, the share price of a company may fall if they are not as good as forecast. The reverse applies if a company posts weak results: if these are not as bad as had been forecast, then the company’s share price might rise! This illustrates an important point: share prices don’t just reflect what is known about a company and its performance, but additionally reflect what is expected in terms of future performance.
2.3 Bonds (fixed interest investments)

The other main kind of financial investment product is a bond, which can be issued by companies or governments. Bonds are also referred to as fixed interest investments.
A bond generally represents a promise to pay a regular rate of interest over a fixed period, from one to 50 years, plus the promise to repay the nominal value (also known as the face value) of the bond (say, £100) on the maturity date. The interest rate is normally fixed, for instance, at 5% or 10% of the nominal value each year.
The nominal value is the amount on which the interest is calculated and can be divided into small amounts for sale, usually £1000 or less. For example, an investor could buy £100 nominal of a ‘five-year 5% bond’. This will pay 5% a year for five years on £100 nominal – that is, £5 a year. The interest may be paid quarterly, semi-annually or annually, depending on the type of bond bought. At the end of the five-year period, an investor would receive £100 in repayment of nominal (or ‘face’) value.
Bonds tend to be less risky than shares because they have a promised interest rate and because company bonds rank in front of company shares in the event of a company being liquidated. Although less risky than shares, bonds are riskier than savings accounts. This is because with savings products typically the amount of capital you receive back is fixed – if you deposit £100, you get £100 back.
With a bond, the amount paid back on maturity is also fixed (but may be more or less than the amount paid for the bond). However, if the bond is sold before maturity, then more or less than the promised nominal amount may be paid. Whether it is more or less will depend on movements in the level of interest rates after the bond has been issued. If interest rates fall, the market value of an earlier issued fixed rate bond will rise since it offers investors an interest rate higher than that currently being offered on newly issued bonds. The reverse applies if interest rates rise.
An additional risk of bonds is if the issuer of a bond defaults. UK government bonds, known as gilts, are seen as safer than bank and building society accounts, as the government is even less likely than a bank or building society to default. Bonds can be bought through stockbrokers or, in the case of gilts, through a special Purchase and Sale Service organised by the Debt Management Office, the government department responsible for issuing government debt.
One problem with bonds is that not everyone means the same thing when they talk of a ‘bond’. The kinds of bond we have described are company or government bonds with a fixed interest rate and a fixed repayment date. But the term ‘bond’ has sometimes been taken in vain. Financial intermediaries have sold bonds that were in effect shares by another name. Similarly, long-term savings products may not only be bank accounts promising interest, but also linked to company bonds or shares. There is no regulation in the UK on terminology, and consequently it is important to read the small print of any product.
Some National Savings & Investment products use the name ‘bond’, for example, Premium Bonds and Income Bonds, but are types of deposit. A range of products, some that are deposits and others more risky investments, used to be called Guaranteed Equity Bonds. Although they have since been reclassified as ‘structured products’, they still individually go by names such as Capital Bond, Stockmarket Linked Bond and Double Asset Bond. Therefore, in reality, the term ‘bond’ is applied to products that are very different, and not just company or government bonds. To get round this confusion, you will also see true bonds referred to as ‘fixed interest’ investments (as noted earlier in this section).
An important product that does not fit within the bonds category that we have described is the Premium Bond. Premium Bonds, owned by over 22 million investors in the UK in 2023, are a lottery-based form of savings account backed by the UK government. A lottery is held every month and the equivalent of 4.65% p.a. (in 2023) on all the Premium Bonds is paid out in tax-free prizes.
2.3.1 Gilts: UK government bonds
An important form of bonds are those issued by the UK Government through the Debt Management Office (DMO).
These bonds are known as ‘gilts’ or ‘gilt-edged stock’, reflecting both the gold gilt that used to be set around the edge of the bonds and the fact that they are generally accepted as being an investment with no realistic risk of default by the issuer (the UK Government).
Most gilts offer a fixed-rate coupon to investors – paid semi-annually and most are issued with maturities of between 5 and 30 years. Some gilts have a zero coupon, though, which means that investors receive no income stream from them. These are issued at a discount so the return to the investor if held to maturity is the difference between the discounted price paid on purchase and the face value paid back on the maturity date.
Some gilts have no maturity date. These ‘undated’ gilts, sometimes also called ‘consols’, just pay an income stream to investors in perpetuity or until the UK Government decides to cancel them and repay investors. This has happened recently. In February 2015, £218 million of undated gilts issued in 1927 to help refinance debts arising from the First World War were redeemed. The Government is also looking closely at the case for redeeming £2 billion of other undated gilts issued after the First World War. The reason for these developments is financial rather than emotional, despite the centennial anniversary of the war, the cost of these gilts to the Government is now higher than the cost of newly issued gilts given in the UK’s current low interest rate environment.
Gilts are marketable and can be traded at any point up to their maturity. As a consequence, the capital price of gilts will move in accordance with market movements. The key relationship here is that the capital price of a gilt will move inversely to movements in interest rates.
Let’s try an example. Let’s say that in 2015 a 10-year gilt was issued paying an annual coupon of 6% per annum. For this example, the face value of the gilt is £100. In this case, £100 is what it cost to buy on the issue date and this is what it will return to the investor holding the bond on its maturity. Note, though, that gilts may be sold on their issue date at a discount or premium to their face value.
Five years later, in 2020, interest rates have fallen such that new 5-year gilts could be issued at an annual coupon of 2% per annum. However, that 10-year gilt issued in 2015, which has 5 years to run until maturity, still pays investors 6% per annum as the coupon is fixed for its life.
So what should have happened to its capital price that was £100 on its issue date? The answer is that it would have risen to reflect the fact that investors will receive 4% more from holding this gilt (with its residual life of 5 years) than they will get from buying a newly issued 5-year gilt.
In very crude terms investors will be happy to pay roughly 20% more than the face value of £100. This equates to the 5 years of higher interest (5 years × (6% - 2%) = 5 years × 4% = 20%) they will receive holding the 6% coupon gilt than the 2% coupon gilt. In approximate terms, the price would rise to £120.
Now, on maturity, the investor would still only get back the £100 face value, generating a capital loss of £20. But this loss is fully compensated for by the higher coupons received during the 5 years of £20 in total (5 × 4% × £100 = £20).
The overall return or yield – or gross redemption yield (GRY) – to the investor ends up being £30 (5 years × 6% × £100 = £30) less the capital loss of £20 – a net total of £10. This matches the return over the 5 years of 2% on the newly issued gilt (5 years × 2% × £100 = £10).
So, while the coupon offers 6% per annum, the overall yield to the investor from buying the 6% coupon gilt with a residual life of 5 years matches the market rate for a new 5-year gilt of 2% per annum.
Note that the maths is a little approximate here – the exact returns would have to take into account the timings of the coupon payments. In the first example above, the exact price that the £100 6% coupon gilt would have risen to, with 5 years to maturity and a prevailing rate of return for 5 year gilts of 2% per annum, would be £118.85. This is achieved by discounting future cash flows relating to the bond by the prevailing market yield. This is a little complex. But the principle is clear: the capital price of existing fixed interest rate bonds moves inversely to movements in the prevailing rates of interest.
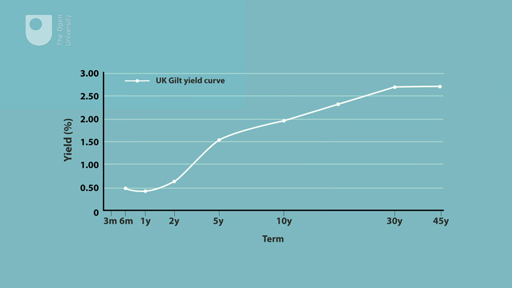
2.3.2 Gilts and the risk-free yield curve
The returns on government bonds (or ‘gilts’) perform a key function in the arena of personal and business finance. The yields provide what is known as the ‘risk-free’ yield curve – the returns you can get for investing in secure (‘default-free’) bonds for different terms to maturity.
Watch and listen to this audio-animation to learn about the ‘risk-free’ yield curve.
In addition to monitoring the Bank Rate and the share prices of certain companies you can also track the yields on two UK government bonds (also known as ‘gilts’).
The two bonds are:-
- Treasury 4.25% 7 December 2027
- Treasury 4.25% 7 December 2046
Both bonds, co-incidentally, have an interest rate (or ‘coupon’) of 4.25% p.a.
The dates shown are the maturity dates of the bonds. The 2027 bond is a ‘medium’ gilt whilst the 2046 bond is a ‘long’ gilt with these terms simply denoting the length of time to their maturity.
You can monitor the price movements and yields of these bonds by setting up a free account withTradeweb. The route to this site can be found on the website of the UK’s Debt Management Office (DMO). When you have done this click on ‘FTSE Closing Prices’ and then scroll down to the two gilts above – labelled ‘UKT 4.25 12/27’ and ‘UKT 4.25 12/46’. The closing yields from the previous trading day are then found across to the right.
Alternatively if you prefer the yields of the gilts can be found in The Financial Times (FT).
Transcript
2.3.3 Corporate bonds and their pricing
Corporate bonds are loans to a company that work in essentially the same way as government bonds. The main difference is default risk. While investors may be confident that a government will repay its loans, a company might not. To compensate for default risk, the return on corporate bonds is normally higher than the return on government bonds with a similar maturity – this premium is called the ‘corporate bond spread’.
Figure 7 shows by what percentage the return on corporate bonds rated Baa by the ratings agency Moody’s exceeded the return on 10-year US government bonds between 1986 and 2023. Note that this difference (or ‘spread’) is often stated in basis points. A basis point is one-hundredth of 1% (0.01%). The figure illustrates how corporate bond spreads can move sharply in response to changing economic conditions. For example the 2007/08 financial crisis resulted in a sharp upward move in corporate bond credit spreads – and not just for financial sector companies. This reflected the (correct) expectation that the financial crisis would trigger a downturn in economic activity globally, thereby adversely affecting the corporate sector generally and increasing the risks associated with investing in corporate bonds.
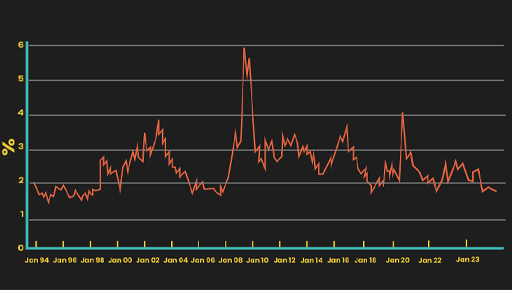
After 2009 spreads started to narrow again as some semblance of calm returned to the financial markets. More recently (in 2020) spreads widened again, mainly as a result of the adverse economic impact of the COVID-19 global pandemic. After the pandemic spreads narrowed again.
Few investors, personal or professional, have the time or means to investigate the credit worthiness of a company. One way to deal with this information gap is to refer to a credit rating agency, an organisation whose business is assessing risk and disseminating this type of information. The list below shows the rating scale used by one of the main international agencies. Personal investors will normally be looking only to invest in ‘investment-grade’ bonds, as defined in the figure. At the top end of the scale, a company assigned a ‘AAA’ rating is thought very unlikely to default on its bond payments, but this is not a guarantee or seal of approval – there is still some risk. The extent to which investors can and should be able to rely on the information from credit reference agencies is discussed later.
General summary of the opinions reflected by Standard and Poor’s credit ratings
Investment grade
-
AAA – Extremely strong capacity to meet financial commitments. Highest rating.
-
AA – Very strong capacity to meet financial commitments.
-
A – Strong capacity to meet financial commitments, but somewhat susceptible to adverse economic conditions and changes in circumstances.
-
BBB – Adequate capacity to meet financial commitments, but more subject to adverse economic conditions.
-
BBB– – Considered lowest investment grade by market participants.
Speculative grade
-
BB+ – Considered highest speculative grade by market participants.
-
BB – Less vulnerable in the near-term but faces major ongoing uncertainties to adverse business, financial and economic conditions.
-
B – More vulnerable to adverse business, financial and economic conditions but currently has the capacity to meet financial commitments.
-
CCC – Currently vulnerable and dependent on favorable business, financial and economic conditions to meet financial commitments.
-
CC – Currently highly vulnerable.
-
C – A bankruptcy petition has been filed or similar action taken, but payments of financial commitments are continued.
-
D – Payment default on financial commitments.
Ratings from AA to CCC may be modified by the addition of a plus (+) or minus (–) sign to show relative standing within the major rating categories.
(Standard & Poor’s, 2009)
2.3.4 Investment funds
Buying shares in a single company or even holding shares in, say, three companies, is generally a risky form of investment. This is because the fortunes of a company, on which its dividends and share price depend, are subject to all sorts of risk. These risks can be broad economic risks, such as recession or an increase in the cost of oil, or risks specific to each company, such as the loss of a major contract or increased competition.
To spread these risks, investors typically invest in shares (and other assets, such as bonds) through investment funds. An investment fund pools the money of lots of investors and uses it to hold a wide range of shares, bonds and other assets. Even relatively small amounts of money placed into such funds can be spread across a wide variety of shares or other assets.
The investments in these investment funds may be selected by managers, based on their research, which aims to assess the prospects for shares and other bonds (called ‘actively managed’ funds). Investors pay fees for the services of the fund managers and are provided with periodic reports on their investments. Other funds (called ‘passively managed’ or ‘tracker’ funds) simply hold investments designed to move in-line with a specified share index, and typically have lower charges.
Investment funds come in many forms, including the following:
- Unit trusts – this is an arrangement whereby trustees hold shares and/or other assets on behalf of investors and a management company makes decisions about what and when to buy and sell. Investors hold units in the unit trust and the value of the units directly reflects the value of the underlying assets in the fund. The price of the unit trust is not, therefore, moved by market demand and supply for the units.
- Open-ended investment companies (OEICs) – this is very similar to a unit trust, but is structured as a company rather than a trust. This structure is more familiar and acceptable to investors in other countries of the European Union and so enables managers to trade more easily across borders. Investors buy shares in the OEIC and the value of the shares directly reflects the value of the assets in the underlying fund.
- Investment trusts – these are companies that are quoted and traded on the stock market. But, unlike trading companies, the purpose of an investment trust company is to run an investment fund. Investors buy shares in the company. The price of the shares reflects both the value of the assets in the underlying fund (called the ‘net asset value’ or NAV) and the balance between investors buying and selling the shares on the stock market. As a result, the shares could trade at less than the NAV (called trading at a discount) or at more than the NAV (trading at a premium). Like any other company, investment trusts can borrow money, which enables them to boost the amount they can invest. Borrowing to invest increases the inherent risk of the fund.
- Exchange-traded funds (ETFs) – these are also companies traded on the stock market but, in this case, the share price is directly linked to the value of the underlying investments. Traditionally, ETFs are tracker funds. This could be, for example, the FTSE 100 Index or a more unusual index tracking, say, the price of commodities or works of art. But, increasingly, new types of ETF are being developed that follow different investment strategies.
- Life insurance funds – some types of life insurance can be used as investments. The investor pays in regular premiums or a single lump sum premium and the policy builds up a cash value that may be drawn out either as a lump sum or as a stream of income payments, depending on the particular type of policy. Often policies are unit-linked, which means that the premiums are invested in the policyholder’s choice of one or more funds, similar to unit trusts. The cash-in value of the policy depends on the performance of these funds.
- Pension funds – in a similar way to life insurance, contributions to a pension scheme may be invested in one or more underlying funds. The value of the pension scheme depends on the performance of those funds. We’ll spend a lot of time this week exploring different types of pension schemes.
Investment funds can be bought directly from fund managers, through stockbrokers or through websites (often called ‘platforms’). You’ll look at the transaction processes and costs in more detail later this week.
An additional consideration for many people is a desire to invest their money in a socially responsible way. There are different aspects to what constitutes socially responsible investment, including both positive and negative criteria.
Positive criteria include investing in companies that treat workers fairly or are engaged in environmental protection. Examples of negative criteria include avoiding funds that invest in companies involved with animal experiments, arms, violating human rights or pornography.
One difficulty for an investor is that ethical or social responsibility is a relatively subjective term so you need to examine where the fund invests your money. One way of checking whether a fund that claims to be ethical or socially responsible shares your own views, is to check the main companies the fund invests in. You’ll return to ethically and socially responsible investment next week when you look at alternative investment strategies.
2.3.5 Investment funds: alternative risk profiles
The previous section set out the types of funds available to investors.
Figure 9 provides a classification of the different categories of investment funds.
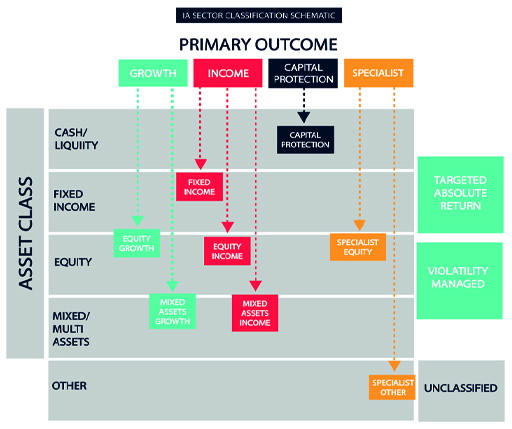
You can find a larger version of this figure here: Larger version of Figure 9
This array of different fund sectors provides the scope to pursue alternative strategies and objectives when managing investments. These include:
- Managing the split of investments between those that are expected to provide income and those expected to provide capital growth. With income and capital growth taxed separately, this enables investors to maximise the benefits of their tax-free allowances.
- Managing the extent to which investments are diversified. Risk-averse investors will tend to see funds that include a range of exposures to different industries or countries or continents. Investors who want to take the risk of focusing on individual sectors or geographic exposures, because of a view they have about the prospects of outperformance, can seek out specialist funds.
- Selecting between funds which are actively and cautiously managed, depending upon the appetite for taking risk.
- Using funds to manage exposure to different asset classes like gilts, corporate bonds, cash investments, property, commodities etc.
- Making decisions about the size of companies invested in. Investing in small companies tends to be riskier than investing in larger companies but the potential returns tend to be commensurately higher too. Why do think this is the case?
2.3.6 Investment funds: how to choose between them
You have looked at the extensive range of investment funds on offer. Now Anthony Nutt, a retired investment director and fund manager, provides his thoughts on how personal investors should go about the process of deciding which funds are best for them.

Transcript
[In this and subsequent extracts of the discussions with Anthony Nutt investors and financial professionals are sometimes referred to as ‘he’. This should not be taken to mean, though, that gender constraints apply in any way to engagement with, or employment in, financial services.]
2.4 Investing in commodities
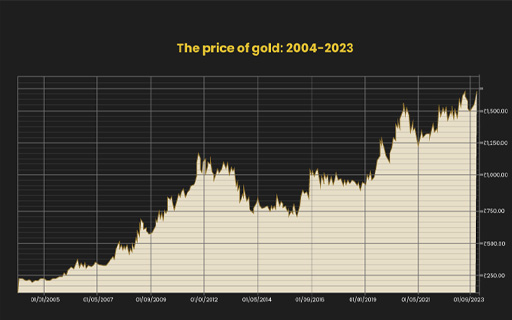
A further category of investments is commodities. This is where the investment is made in assets like oil, gold and other metals or even agricultural products.
Generally there are two major attractions to these investments:
- The prices of commodities tend to rise during periods of price inflation. They consequently offer a ‘hedge’ against the risk that inflation erodes the real value of your investments.
- Commodity prices also often move in the opposite direction to other asset classes like shares and property. Indeed, during periods of weakness in equity markets investors are inclined to move to gold. As a consequence, investing in commodities can be an effective way to balance the risks on a portfolio also containing assets like shares and property.
The other side of the coin, though, is that commodity prices can be volatile and are certainly at risk of periodic sharp falls. You can see this in the chart above. In some ways, such investments have the same risk as investing in an individual share as opposed to investing in a balanced portfolio of shares.
How can investments in commodities be made? A number of options exist.
First, where practicable, the investments can be made in physical form with the commodity itself being purchased and stored. This is feasible when it comes to commodities like gold – witness the trade in gold coins. There are, though, insurance issues that need to be considered when doing this given the risk of physical loss through theft etc. Additionally, for the ordinary investor, stockpiling holdings of commodities like oil or corn will simply be impracticable.
Second, investments can be made by trading in those commodities which have an active futures market. This is investors can take positions both buying and selling future delivery of commodities in non-physical form via a financial market. If you want to add a commodity to your portfolio you can simply enter into a contract to buy it at a defined future price and, conversely, contract to sell if you are reducing your holding. Engaging in these contracts, though, does require some sophistication both in terms of understanding how futures markets operate and in being able to comply with the operational aspects of being a futures trader.
A third option is simply to buy the shares on companies whose financial performance is most related to the underlying commodity you want to invest in. So mining companies’ shares could be bought if you want to invest in defined metals; oil companies’ shares can be bought if you want to invest in oil. While this presents a straightforward way to get exposure to commodities this method of investment has weaknesses. In many cases, the financial performance of such companies and the movements in their share prices are only loosely correlated to the commodities associated with them. The performance of major oil companies, for example, is linked to an array of factors, like the taxation of petrol, which are unrelated to the price of oil.
The fourth option is, arguably, the most secure route to gaining exposure to commodities: invest in funds that track the price of a specific commodity or defined basket of commodities. This can be done by placing money into exchange traded funds (ETFs) – you’ll look more at ETF’s next week. This way of investing in commodities is reasonably simple and affords the ability to customise and risk manage your exposure to commodities.
2.4.1 Investing in peer-to-peer products
To complete the review of investment products, let’s look at one that has only been around for a few years – but which has rapidly become popular – peer-to-peer lending. But it is also an area yet to be tested by a severe economic recession, and as we were putting this course together, the financial effects of the Covid-19 pandemic were only just starting to hit. So before investing in peer-to-peer, be very careful.
This market has grown because beleaguered savers who have seen returns on their accounts fall to miserly levels in recent years, and to levels below the rate of price inflation, are being increasingly tempted by peer-to-peer (P2P) lending. However, it must be stressed that these are investments that come with risks and are not savings products – in fact, some firms have been reprimanded by the FCA for making them look like savings products.
This growing market involves investors pooling their funds with other investors to lend to individuals and businesses. The P2P providers undertake the credit checks on those borrowing from the schemes, and they take a cut as their profit. There are no banks or other financial intermediaries. The returns offered by investing in a P2P pool are attractive relative to those on ordinary savings accounts – assuming borrowers pay the money back.
The attractions of this alternative investment have seen this form of lending growing, with £3 billion being lent in the UK in 2018, according to the Peer2Peer Finance Association. The Peer2Peer Finance Association was absorbed by Innovate Finance in 2020.
Note that peer-to-peer lending is different from another product you might hear about – ‘crowdfunding’. Peer-to-peer lending provides loans, whereas crowdfunding provides equity finance to companies. In effect, crowdfunders are buying shares in the companies they are lending to.
Beware the significant risks of P2P lending
Although P2P is regulated by the Financial Conduct Authority (FCA), it does have risks that investors need to be aware of. Risks certainly exist – why else would the returns markedly exceed those on no-risk investments such as National Savings & Investments (NS&I) products? The key risk is of defaults by those who have borrowed from P2P funds – although those managing the funds mitigate this by spreading the funds invested across a number of borrowers. Even if the money lent is fully recovered from a defaulting borrower, there is likely to be a long wait to receive back the funds you invested.
Another key factor to bear in mind is that P2P investments are not currently covered by the Financial Services Compensation Scheme (FSCS), meaning investors could lose all their money if a P2P provider went bust.
One final tip before investing in P2P: check the FCA website to make sure the company is registered with the regulator.
Activity 2.5 Testing the robustness of the P2P market
Some analysts claim that the attractiveness of the P2P market can only be tested if the economy experiences a sharp economic slowdown. What is the reason for this opinion?
Answer
The key risk to investors in P2P products is borrowers defaulting on repayments. In benign economic conditions with the economy growing and interest rates low, the rate of defaults may be very low, perhaps giving a false impression of the riskiness of this way of investing. The acid test would be to see how the default rate changes if the economy is in difficulties – e.g. a major recession. Only then will investors have a fuller picture of the risks they are taking for receiving interest earnings well above the prevailing level on conventional savings products. At time of writing, we don’t yet know the full economic effect of the Covid-19 pandemic – this will be the acid test about whether P2P investments are robust, and we await the results with some trepidation.
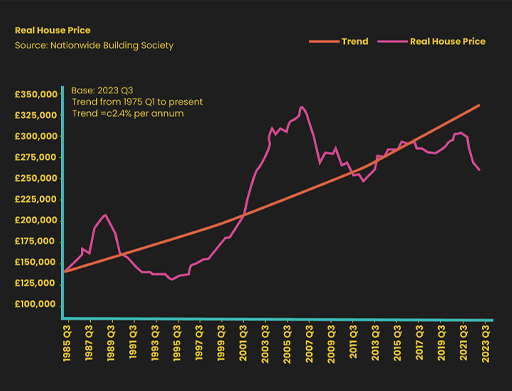
2.4.2 Housing as an investment
In recent decades property has become increasingly considered as a serious alternative to other kinds of investment.
Driven by the liberalised financial services sector, which made mortgages easy to obtain, and a boom in house prices, property was seen as a one-way bet. When property prices began to decline in 2008, investing in property for capital gain began to look like a more uncertain strategy. After 2012 property prices continued their upward trend. More recently, though, the sharp rise in interest rates in 2023 and 2023 has resulted in a fall in average property prices.
This is not to say that you should overlook the investment in your own home. It’s easier to raise finance on the ‘primary residence’ than on second homes; there’s only one set of interest costs to worry about and there’s normally no liability for Capital Gains Tax on any profit made. The objective with your home (apart from having somewhere to live) would be to increase its capital value and so the equity in it. There are several ways in which that can happen over and above any general rise in property prices.
Homes can be bought in an ‘up and coming’ area where property prices will rise more than the average; they could be bought at below the ‘true’ market value; or someone can add value to a property by finding, for instance, a run-down home suitable for refurbishment and, when completed, sell at a profit over and above the total cost of the purchase, interest and refurbishment.
The video, from October 2013, explores the way in which the purchase of property as an investment has continued to be popular and to have a significant impact on property prices, particularly in areas like London.

Transcript
Another way to make money from a home is to rent out a spare room, effectively using the home as an income-producing asset. Some people carry these ideas substantially further and rent out several rooms, or regularly buy, develop and then sell individual properties. Doing either would move into the realms of trading, and as a result both Income Tax ‘Rent-a-Room’ relief and Capital Gains Tax exemptions would be lost.
An alternative way to invest in property without directly owning specific properties is through investment funds – particularly Real Estate Investment Companies (REICs). You’ll look more closely at these in Week 3.
A further way that property, including property that you live in, can be used to generate cash is through equity release schemes. This involves receiving a cash sum, representing part of a property’s value, after allowing for any outstanding mortgage on the property, in exchange for which the lending institution receives an equity share of the property. This sum advanced, plus interest added over time, is then repaid when the property is eventually sold – perhaps on the death of the borrower. Equity release schemes are controversial but may be used to provide cash, particularly for those who have retired.
In 2015, two decisions were made by the UK government to take some of the heat out of the booming buy-to-let market. From April 2016, Stamp Duty Land Tax (SDLT) paid on property purchases above £40,000 has had a 3% surcharge. For a £250,000 property purchase, this adds £7,500 to the cost of the purchase. The surcharge also applies when second or further homes are bought, even where these are not let to tenants. From April 2017, landlords have only been able to claim tax relief on mortgages used to acquire buy-to-let property at the basic rate of income tax (currently 20%). It will be interesting to see if this cools the buy-to-let market or whether these higher costs are passed on to tenants in the form of higher rents.
Note that SDLT applies only in England and Northern Ireland. The equivalent in Scotland is Land and Buildings Transaction Tax (LBTT). In Wales the equivalent is Land Transaction Tax (LTT).
2.4.3 Buy-to-let

Another development, particularly from the mid-1990s onwards, has been the growth of the ‘buy-to-let’ sector. This has become more common as a result of the development of specialist buy-to-let mortgages in the competitive mortgage marketplace and the introduction of the Assured Shorthold Tenancy contract which gives landlords greater powers to terminate tenancies.
Buy-to-let mortgages allow expected rental income to be taken into account when assessing the borrower’s ability to afford a mortgage on a property intended for rental. While the financial crisis that began in 2007 impacted on house prices and led to mortgage providers demanding larger deposits, buy-to-let can still be an alternative to, or complement, other investments or pension plans. This is because even if the future direction of property prices is not known with certainty, buy-to-let landlords can still make a return from the rental income they receive.
In fact, there were some media reports that uncertainty in the property market was good for buy-to-let investors. This was because first-time buyers were reluctant to enter the market which, combined with the large deposits required from those who wanted to buy, meant there was more demand in the rental sector (Telegraph, 2010).
Another report argued that although buy-to-let played a part in the house price boom, it also increased the size of the private rented sector and therefore helped to keep prices lower than they otherwise might have been (National Housing and Planning Advice Unit, 2008).
2.4.4 What are the risks?
Suppose you own a property as an investment.
Activity 2.6 Property risks
What are the risks of using that property as an investment rather than as a home? What are the risks of letting out the property?
Note your thoughts below.
Discussion
The risks of letting out an investment property include:
- property prices falling – something that can and does happen when economic activity is weak
- the landlord being unable to find tenants for the rental property for a period of time
- higher than anticipated costs on the property (for instance, on maintenance or renovation).
These risks reinforce the need for careful calculations and expert advice.
2.4.5 Taxation
Start by looking at the table to see the details of the allowance and tax bands for different forms of investment in 2023/24.
| Allowances and tax bands 2023/24 | Income band | Earnings, pensions and rental income | Interest from savings and bonds | Dividends from shares and bonds |
|---|---|---|---|---|
| Personal allowance | First £12,700 | 0% | 0% | 0% |
| Starting rate band for savings | Next £5000 | 20% | 0% ** | 8.75%* |
| Basic rate tax band | Next £32,700 | 20% | 20% *** | 8.75%* |
| Higher rate tax band | Next £ 74,740 | 40% | 40% *** | 33.75%* |
| Additional rate tax band | Over £125,140 | 45% | 45% *** | 39.35%* |
Footnotes
* These rates only apply to taxable dividend income in excess of £1000. The first £1000 is tax free.Footnotes
** Only applicable to savings income if taxable non-savings income does not exceed £5000.Footnotes
*** These rates apply to taxable savings income in excess of £1000 (basic-rate taxpayers) or £500 (higher-rate taxpayers). The first £1000/£500 of such income is protected by the Personal Savings Allowance (PSA) which makes the income tax-free. Additional rate taxpayers do not qualify for the PSA.Footnotes
Note that slightly different rates apply in Scotland.The taxation of interest from bonds, also known as fixed interest investments (and unit trusts and OEICs that invest mainly in bonds) is very straightforward because it is taxed in the same way as interest from a savings account. However, unlike savings accounts, interest from most bonds is paid out gross (without any tax already deducted).
Gains from investments are subject to Capital Gains Tax (CGT), although there is an annual tax-free allowance (of £6000 in 2023/24). Only gains in excess of this amount are taxed either at 10% for those who are no more than basic rate income taxpayers or 20% for higher or additional rate income taxpayers. If the gain arises from the sale of a property that is not a prime residence the tax rate applied is 18% for those who are no more than basic rate income taxpayers or 28% for higher or additional rate income taxpayers.
The rules on CGT are quite complex. Follow this link to learn more: Capital Gains Tax (CGT).
As explained earlier, most of the tax on savings and investments can legally be avoided by investing through ISAs.
So, in summary, there are two main types of tax for UK investors: Income Tax and Capital Gains Tax. Interest from savings and bonds, and dividends from shares, are taxed as income; the profit from selling something for more than it originally cost is typically taxed as a capital gain. Income and gains from some savings and investments are tax-free and, even when they are taxable, the investor may have tax-free allowances to use so that in practice no tax is due.
Tax-efficient investment means choosing tax-free products, using allowances and taking advantage of the difference in tax rates between different types of income and between income and gains – for example, choosing an investment that pays gains rather than income when your gains are protected by being below the capital-gains tax allowance whilst additional investment income would become subject to income tax.
2.4.6 Transaction costs
Buying investments involves transaction costs. These can include:
- the bid-ask spread
- brokerage commission/dealing costs
- transaction costs
- management charges.
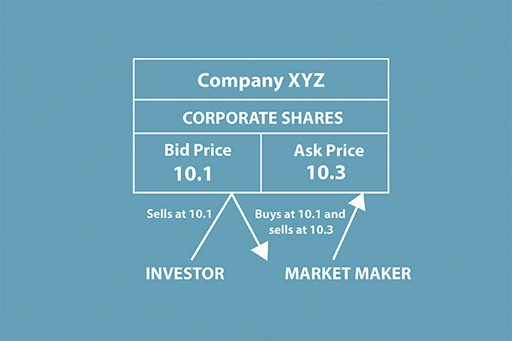
If we look first at a simple transaction of 100 Royal Dutch Shell shares, the bid–ask spread is the difference between the price at which the investor can buy the Shell shares (the ask) and the price at which the investor can sell them (the bid). Suppose that the bid–ask spread for 100 Royal Dutch Shell shares is £17.10 – £17.20. This means that the investor can sell 100 shares at £17.10 or buy 100 shares at £17.20, to allow a profit for the so-called marketmaker. The bid is the price at which the marketmaker bids for shares; the ask is the price at which the marketmaker asks investors to buy shares.
For the investor, the bid–ask spread represents a transaction cost. The price at which they can buy shares is always more than the price at which they can sell them, so there is an inbuilt capital loss from day one – in this case 10p per share. Also, the smaller the number of shares traded, the larger the bid–ask spread, to reflect relatively fixed handling costs. Institutional investors, trading in large amounts, say 100,000 shares, will experience a much narrower bid–ask spread than will the small investor.
Stamp Duty Reserve Tax (SDRT) of 0.5% is paid when shares are bought electronically (which the vast majority are these days). SDRT is not paid when shares are sold. Share prices can be seen in most newspapers that report daily on share prices as well as on other information.
It is normal to buy or sell shares through a stockbroker or brokerage firm, either by telephone or on the internet. Again, charges vary according to the size of the trade, with a minimum brokerage commission of, say, £12 for each transaction. This is a relatively small percentage of a £10,000 trade, but makes trading in £100 amounts uneconomic. Online brokers tend to be cheaper than traditional brokers as they provide no investment advice, usually restricting themselves to basic information on the companies in which they trade.
Finally, there are the management charges payable to institutional fund managers in return for choosing the investments on behalf of clients. These charges have to be disclosed in the documentation but are taken by the manager from the funds invested with them and so are rather hidden from view, particularly with long-term investments. Although a representative 1.5% annual management charge does not sound that large, it can mount up and reduce returns substantially over the long term, as, for example, with pensions. You should also check if there are any other costs like custody and administration charges. These all need to be set out in the documentation provided by the institution you are doing your investment business with.
The 2006 White Paper on Personal Accounts, published by the Department for Work and Pensions, examined the case of a male median earner (£23,000 a year in 2006/07 terms) who was aged 25 in 2012. By contributing 8% of his earnings each year for 43 years to a pension scheme, with a real rate of return of 3.5%, he would have a pension fund worth £87,000 at the age of 68. With a 1.5% management charge, typical of active pension fund management charges, the fund would be worth only £63,000, with £24,000 having been deducted in management charges. With charges of 0.5 per cent instead of 1.5 per cent a year, the fund would be worth approximately 25 per cent more on retirement.
2.4.7 Where to transact and when to seek advice
Two key questions to ask when making investments are ‘where do I go to transact business?’ and ‘should I seek advice first?’.
In terms of where to go, as noted in the previous sections, investors are currently spoilt for choice. Traditionally, investors would go directly to a financial services product provider like their bank, building society or insurance company. Alternatively, a financial adviser could be employed – both to provide advice on the placement of investments and to carry out the practicalities of completing the acquisitions or disposals of assets.
In the contemporary world, the internet provides the medium for fluid investment management transactions. This makes for ease in terms of the selection of investments and for transactions, although investors will need to consider whether advice is needed before keying in the instructions to an investment platform.
The issue about advice is something all investors should consider carefully: am I really sufficiently knowledgeable about the attendant risks and returns to make investment choices?
Following the introduction of new rules in 2013 requiring investment providers to be fully transparent about their costs, the proportion of investors deciding to invest privately, rather than rely of advice, has increased. A poll of investors by the online investment platform, Interactive Investor, found that one in five now prefer to make their own investment decisions, having previously relied on an adviser to assist them (Sunday Times, 2014).

Transcript
Listen to the views of retired investment director and fund manager, Anthony Nutt, on the issue of when to take advice. Then, in the next section, we’ll run through a check list to help you form your own view of this important matter.
2.4.8 Do I need financial advice or should I go it alone?

A key decision to take when investing is whether to seek advice from a financial adviser.
What are the pros and cons of this?
The benefit of getting advice is that you should get the products that meet your needs and your risk appetite. To achieve this, advisers should carry out a fact find, where they ask details about your circumstances, goals, time horizons for these goals and your capacity to absorb losses on investments.
Different types of advisers and different types of sales
Note that some advisers are independent, in that they are not tied to a specific set of investment products. Independent advisers can provide guidance on the full range of products you are interested in investing in. By contrast some advisers just offer a ‘restricted’ service linked to a defined range of products and not the full market. Advisers do have to disclose whether they’re ‘restricted’ or not in the guidance they provide.
There is a clear difference between advised and non-advised product sales. Non-advised sales involve being talked through options with the decision about which product to invest in being left with you.
Advised sales point you to particular products. If you end up with an unsuitable product after being recommended it by an adviser then you may have a case for claiming that it has been ‘mis-sold’ to you.
When should I seek advice?
- For cash savings products it’s easy to make decisions using internet comparison sites. With no risk to the capital sum invested you normally don’t need to receive financial advice.
- When investing in shares and bonds, either individually (i.e. a specific company’s shares) or in a fund like a unit trust, then it may be prudent to seek advice.
-
If your answer is no to at least one of the following questions then seeking financial advice is prudent. If the answer is no to all three questions, advice is really essential.
If your answer is yes to all three questions, you can consider yourself able to make your own decisions and to transact without advice using a low cost provider (e.g. an internet platform) of the products you want.
The key questions to ask yourself are:
- Am I an experienced investor?
- Can I afford to lose at least part of the capital sum invested?
- Have I the time to both put in the research ahead of investing and then monitor the investment after I have acquired it?
- For pension products advice should be sought. For workplace pensions your employer will either provide advice or access to advice about the scheme(s) on offer and their costs to you. For a private pension it is sensible to seek advice even if you consider yourself to be knowledgeable about investments. The consequences of investing in an inappropriate pension product can be financially devastating. The new rules on access to pension funds, that came into effect in 2015, really make it important that advice is sought, not only in respect of entering into a pension product but also in accessing the funds it generates as you move towards and into retirement.
What do I get charged for advice?
From 2013 advisers have been required to set out explicitly the fees charged for the advice provided. These fees vary from adviser to adviser so don’t just glance at them, look at the fees carefully and check how they compare with those of other advisers.
If you are seeking general financial advice or advice in respect of specific products, advisers will normally charge a fee and be required to advise you of the fees they charge upfront. Some advisers may be prepared to provide an initial consultation free of charge – so why not ask if they do this when arranging an appointment.
Previously, advisers earned their income by receiving commission from the product providers which was then deducted from customers’ initial or ongoing investment. This practice has now been stopped to ensure that there is complete transparency about fees charged.
Do note the difference between the fees charged by advisers and the ongoing management charges applied by product providers, particularly when the investments are ‘managed’ (looked after actively by fund managers) as opposed to being placed passively (and left unmanaged) throughout the life of the investment.
Where do I go to find an adviser if I need one?
There are plenty of ways to locate a financial adviser. Your bank will be able to help and an internet search will too.
Two sources are particularly useful when it comes to locating advisers and obtaining financial advice.
MoneyHelper - the personal financial advice service provided by the government’s Money and Pensions Service (MaPS) - provides detailed guidance on financial advisers.
Additionally unbiased.co.uk provides a list of authorised financial advisers.
2.5 Week 2 quiz
Check what you’ve learned this week by taking the end-of-week quiz.
Open the quiz in a new window or tab then come back here when you’re done.
Week 2 round-up
You’ve covered plenty of ground this week, examining the array of principal assets that you can invest in, including savings accounts, shares, bonds and commodities.
You’ve also looked at the costs of investing and the impact of taxation on investment returns.
You must now turn to the factors that you should consider when building up your investment portfolio. To avoid investing either foolishly or irrationally, you need to have a strategy and that strategy must be informed by the key principles of investment management. That is what you will turn to next week.
You can now go to Week 3 .
Further reading
Money Advice Service savings calculator If you want to explore savings accounts further and the returns you receive on them, why not access the Money Advice Service (MAS) savings calculator.
Images
This free course was written by Martin Upton.
Except for third party materials and otherwise stated in the acknowledgements section, this content is made available under a Creative Commons Attribution-NonCommercial-ShareAlike 4.0 Licence .
The material acknowledged below is Proprietary and used under licence (not subject to Creative Commons Licence). Grateful acknowledgement is made to the following sources for permission to reproduce material in this course:
Figure 3 © Kord.com via Getty Images
Figure 5 © stocknshares via iStockphoto.com
Figure 6 © spxChrome via iStockphoto.com
Figure 8 All logos shown are Registered Trademarks or Trademarks of their respective companies
Figure 10 adapted from https://goldprice.org/ gold-price-chart.html
Figure 12 © georgeclerk via iStockphoto.com
Figure 13 © michellegibson via iStockphoto.com
2.1.3 Jonquil Lowe on Bolton FM Radio (March 2014)
2.1.4 © The Open University
2.3.6 © The Open University
2.4.7 © The Open University
Every effort has been made to contact copyright owners. If any have been inadvertently overlooked, the publishers will be pleased to make the necessary arrangements at the first opportunity.
Don’t miss out:
If reading this text has inspired you to learn more, you may be interested in joining the millions of people who discover our free learning resources and qualifications by visiting The Open University - www.open.edu/openlearn/free-courses.
1. Join over 200,000 students, currently studying with The Open University – http://www.open.ac.uk/ choose/ ou/ open-content
2. Enjoyed this? Find out more about this topic or browse all our free course materials on OpenLearn – http://www.open.edu/ openlearn/
3. Outside the UK? We have students in over a hundred countries studying online qualifications – http://www.openuniversity.edu/ – including an MBA at our triple accredited Business School.
References
Daily Telegraph (2023) Markets, p. 26, 11 October 2023
Cottle, S., Murray, R.F. and Block, F.E. (1988) Graham and Dodd’s Security Analysis, 5th edn, New York, McGraw-Hill.
FRED Economic Research (2023) Moody’s seasoned Baa corporate bond yield relative to yield on 10-year Treasury constant maturity [online] Available at https://fred.stlouisfed.org/ series/ BAA10Y (Accessed 11 October 2023)
Gold.co.uk (2023) Last 20 years’ gold price [online] Available at https://www.gold.co.uk/ gold-price/ 20year/ ounces/ GBP/ (Accessed 11 October 2023)
Gov.UK (2023a) Income tax rates and personal allowances [online] Available at https://www.gov.uk/ income-tax-rates (Accessed 11 October 2023)
Gov.UK (2023b) Tax on dividends [online] Available at https://www.gov.uk/ tax-on-dividends (Accessed 11 October 2023)
The Investment Association (IA) (2020) ‘IA Sector Classification Schematic’ [online], https://www.theia.org/ industry-data/ fund-sectors/ classification-schematic (Accessed 7 December 2020)
Nationwide (2023) UK house prices adjusted for inflation [online] Available at https://www.nationwidehousepriceindex.co.uk/ resources/ f/ uk-data-series (Accessed 11 October 2023)