Minerals and the crystalline state
Use 'Print preview' to check the number of pages and printer settings.
Print functionality varies between browsers.
Printable page generated Thursday, 18 June 2026, 4:03 AM
Minerals and the crystalline state
Introduction
Rocks are made of minerals and, as minerals are natural crystals, the geological world is mostly a crystalline world. Many large-scale geological processes, such as the movement of continents and the metamorphism of large volumes of rock during mountain building, represent the culmination of microscopic processes occurring inside minerals.
Minerals and rocks are also natural resources that provide the inorganic raw materials for almost everything humans use. A good scientific understanding of their origins, occurrence and properties helps to maximise their potential benefits to humanity.
In this free course, you will study mineral and rock (and fossil) specimens as interactive images in a resource called the Digital Geology Kit, which is described briefly in the box below and then in more detail in a subsequent activity.
Accessing the Digital Geology Kit
The Digital Geology Kit is one of a number of interactive, practical science resources that you can access from The OpenScience Laboratory website: a collaborative initiative of The Open University and The Wolfson Foundation. Here you will find investigations, tools and activities coving a broad range of scientific fields, including Earth science, astronomy and health.
Links to the Digital Geology Kit appear at relevant points within this course. When you first access the tool you will be prompted to either sign in (if you are already an Open University student), or to register with you email address to create an account free of charge. This only takes a few minutes to do.
Note that the interactive activities on the OpenScience Laboratory website require a modern web browser, such as Mozilla Firefox, Google Chrome, Apple Safari or Microsoft Internet Explorer 9 or later.
This OpenLearn course is an adapted extract from the Open University course S209 Earth science.
Learning outcomes
After studying this course, you should be able to:
give, with an appropriate example, the meaning of the terms phase, phase boundary and phase transformation, and interpret stability fields in terms of pressures and/or temperatures using a phase diagram
describe and recognise, giving examples, various physical properties of minerals, including lustre, cleavage, hardness and density
describe, giving mineral examples, the main differences between metallic, ionic and covalent structures and their type of bonding
explain the significance of various types of defects in crystals
explain the meaning of the terms lattice, unit cell, reflections and rotational symmetry, and how these relate to crystal systems.
1 Introducing crystals
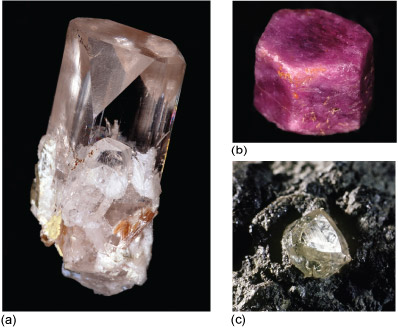
Three distinct types of crystal, each of which is a different mineral, can be seen in the granite shown in Figure 1: shiny black biotite mica; cloudy white feldspar and translucent grey quartz.
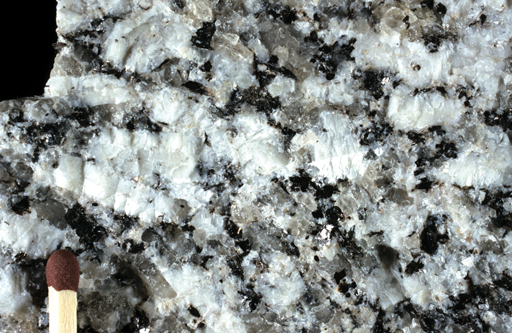
The junction between any two adjacent crystals in the rock is called a grain boundary. Grain boundaries occur where crystals develop in contact with each other - here, during the cooling and crystallisation of magma to form granite. Grain boundaries also develop when minerals grow in the solid state during metamorphism.
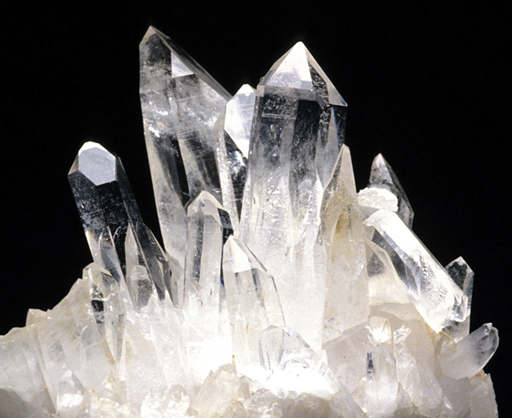
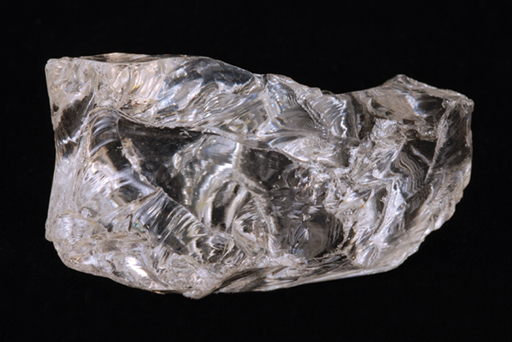
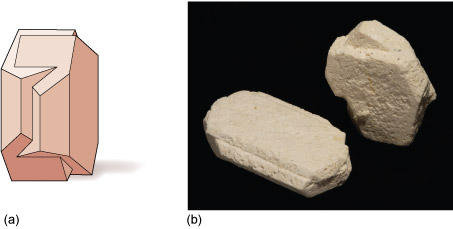
Where the crystals form an interlocking mass, as in granite or marble, they rarely have the opportunity to develop good crystal faces. By contrast, the best-formed crystals are often ones that have grown into cracks or cavities (such as a gas bubble in a lava flow). Figure 2 shows several such quartz crystals that have grown into a cavity.
Crystals may be objects of great beauty, in part because of their almost perfectly flat crystal faces and geometric shapes. This regular external appearance is caused by a highly ordered internal arrangement of atoms known as the crystal structure, which leads to distinct, and to some extent predictable, physical and chemical properties.
Minerals, by definition, are solid substances. Before looking at the crystalline world in more detail, the next section considers briefly the various physical states that matter can have, and the transition from one state to another. These are concepts that are relevant at various stages throughout the course.
2 States of matter
Substances generally exist in one of three different states: as a gas, liquid or solid. Figure 3 illustrates these states in terms of their atomic arrangements, with small black arrows representing relative velocities of atoms or molecules in the liquid and gas. Atoms or molecules in a gas move at high velocities, and the distances between them are large, so gases have low densities. In a liquid, the atomic motions are slower, and the atoms are closer together (producing a higher density).
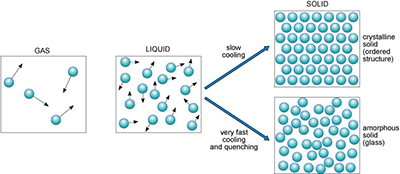
If you could take a snapshot of the atoms in a liquid or a gas, you would see a random or disordered arrangement. Another snapshot, taken a fraction of a second later, would look different. So, the internal structures of liquids and gases are disordered both in space and time.
A kind of real-life snapshot of a liquid structure can be taken by very rapidly cooling the liquid to quench it, so that it solidifies before the atoms have had time to rearrange themselves. At low temperatures, there is not enough thermal energy for the atoms to move relative to each other. The quenched material is a disordered solid, known as an amorphous solid or glass (Figure 3).
By contrast, slow cooling of a liquid allows atoms to arrange themselves into an ordered pattern, which may extend over a huge number of atoms. This kind of solid is called crystalline. So if a melt of a given composition (e.g. SiO2) is cooled very rapidly it will produce a silica glass, whereas if it is cooled slowly it will produce a crystalline solid composed of quartz crystals.
It is important to note that compared with crystalline solids, glass is not a particularly stable form of matter. Over many years, glass may slowly convert into a crystalline form in a process called devitrification. This can sometimes be observed in centuries-old window panes, where circular frosted patches of tiny crystals have formed within the glass.
The states in which a single substance can exist - gas, liquid or solid - are referred to as phases of matter. The range of pressures and temperatures over which a particular phase is stable (i.e. its stability field) can be shown on a phase diagram. The stability fields of different phases may be represented as areas separated by boundary lines on a pressure-temperature diagram, as illustrated in Figure 4, a phase diagram for H2O. A change of temperature (or pressure) may result in a phase transformation; for example, liquid H2O (water) can be heated to form a gas (steam), or cooled to form a solid (ice).
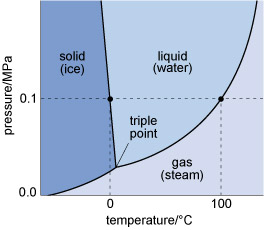
At the surface of the Earth, with a typical pressure of one atmosphere (approximately 105 Pa), a crystalline solid, ice, is the stable phase of H2O at temperatures below 0 °C. Above this temperature (the melting point of ice), solid ice transforms to liquid water. The boundary between the solid and liquid stability fields is a phase boundary, and is indicated by a solid line in Figure 4. If the temperature continues to increase at constant pressure (along the horizontal dashed line in Figure 4), the phase boundary between the liquid (water) stability field and the gas (steam) stability field is reached. This boundary represents the boiling temperature of water.
Although only the effect of changing temperature has been considered so far, it is important to note that both the melting temperature and the boiling temperature vary with pressure. The point where all three phase boundaries for H2O meet is called the triple point, a unique pressure and temperature where solid (ice), gas (steam) and liquid (water) can coexist.
How would the boiling temperature of water, measured at the top of a high mountain, where the atmospheric pressure is low, compare with its boiling temperature at sea level (where atmospheric pressure is relatively much higher)?
The H2O phase diagram (Figure 4) shows that the boiling temperature of water (indicated by the liquid/gas phase boundary) decreases with decreasing pressure. Thus, on top of a mountain, where atmospheric pressure is lower, water boils at a lower temperature.
3 Physical properties of minerals in hand specimen
Physical properties, such as colour and density, are those that can be observed without causing any change in the chemical composition of a specimen, whereas chemical properties determine how a substance behaves in a chemical reaction. Many of the physical properties of minerals can be predicted from a detailed knowledge of their crystal structures, which can be obtained by various analytical techniques. Alternatively, physical properties can be used to infer particular aspects of a mineral's internal structure.
Several physical properties of minerals can be readily observed in hand specimen and can be used for recognising and distinguishing different minerals. In this course you will do this using the Digital Geology Kit, which is introduced in the next activity.
Activity 1 Introduction to the Digital Geology Kit
Task 1
Begin by watching Video 1 to familiarise yourself with the functionality of the Digital Geology Kit. (You will need to view it in 'Full Screen' mode in order to see in detail the various tools and features.) Then answer the associated questions.
Transcript: Video 1 Introduction to the Digital Geology Kit.
Question 1
Select the specimen 'Variety amethyst' from the 'Quartz' list of minerals in the Digital Geology Kit. How long is the amethyst crystal on the far left? Measure it using the graticule.
Answer
It is about 16 mm. Note that there are large divisions on the graticule every 10 mm.
Question 2
Now go to 'Red crystals in gneiss' in the 'Garnet' list. Go to coordinates X = 1860, Y = 930. (Note that, hereafter, the X and Y labels will be omitted on all coordinates, e.g. this point would be '(1860, 930)'.) Is any red garnet visible at the point denoted by the cross hairs?
Answer
No, garnet is not visible at this point; only a white mineral is visible at the stated coordinates.
3.1 Crystal shape
Well-developed crystals show a number of flat faces and a distinct shape. The shape of the crystal and the precise arrangement of its crystal faces relate to its internal structure, and are expressions of the regular way the atoms are arranged.
Many terms are used to describe the shapes of different crystals. These can be broadly grouped into three categories:
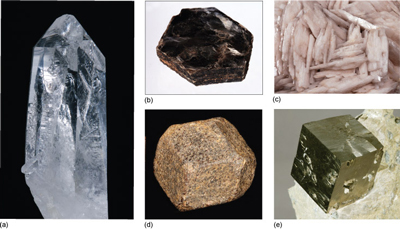
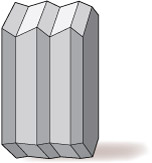
- prismatic (the crystal is stretched out in one direction; Figure 5a)
- tabular (the crystal is squashed along one direction, so appears slab-like or 'platy'; Figures 5b and c)
- equidimensional (the crystal has a rather similar appearance in different directions, e.g. cubes, octahedra, and 'rounded' crystals with many faces of similar size; Figures 5d and e).
Crystals of the same mineral tend to show the same general crystal shape. Quartz, for example, is almost always prismatic, rather than tabular or equidimensional. However, the exact shape of crystals of the same mineral can vary depending on the conditions at the time of growth. Two crystals of the same mineral may differ in the relative sizes of specified crystal faces, or some faces may not be present.
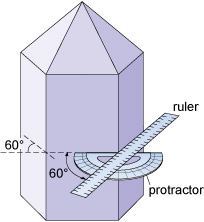
Although the relative sizes of specific crystal faces often vary, the angles between such faces are always fixed as they are defined by the crystal structure. This consistency of angles may be verified by measuring the angle between crystal faces with, for example, a protractor (Figure 6) or a more accurate device called a goniometer.

Some minerals have a crystal shape that is best described as acicular (i.e. needle-like). In which of the three general categories of crystal shape mentioned above do acicular crystals lie?
Acicular crystals belong to the prismatic category as they are stretched out in one direction.
Note that there is often a distinction between the shape of individual crystals and the form they may take when many crystals are assembled into an aggregate. For example, some minerals have acicular crystals that radiate in all directions away from a central point, forming a globular (i.e. spherical) aggregate. Aggregates may also be, for example, fibrous, columnar or dendritic (clusters of crystals in fern-like branches). When crystals grow together in a solid mass, in which individual crystals cannot clearly be seen, aggregates are described as massive.
3.2 Colour
The colour of a mineral can be its most obvious feature, but colour can also be one of the least reliable properties for identifying minerals. Many minerals show a wide range of coloration, often caused by tiny amounts of impurities.
For example, pure quartz (SiO2) is colourless, but minute quantities of Fe3+ iron induce a purple coloration, characteristic of the variety of quartz known as amethyst (Figure 7a). Small amounts of aluminium cause the dark coloration of smoky quartz when the crystal has been exposed to natural radioactivity (Figure 7b). The reason for the pink colour in rose quartz (Figure 7c) is not fully understood; titanium or manganese may be involved, as may minute fibrous crystals of a complex mineral within the quartz.
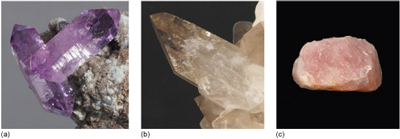
The yellow colour of citrine (another quartz variety) is probably due to minute amounts of iron hydrates dispersed within the crystal. (Many examples of citrine for sale are actually artificially heated or irradiated amethyst.) Milky quartz is white and cloudy as a result of tiny bubbles of fluid (liquid and/or gas).
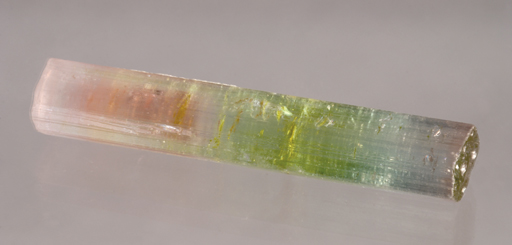
In a few minerals, such as tourmaline, an individual crystal may be multicoloured (Figure 8), reflecting subtle changes in chemical composition as it grew. Although most commonly black, other colours of tourmaline include brown, green, pink, blue or yellow. Here, a single crystal varies markedly in colour along its length (5 cm). In this case, the green part has the most iron, and the pink colour is due to trace amounts of manganese.
Some minerals do, however, have reliable and distinctive colours. Silicate minerals that contain large amounts of iron are typically dark green or black. These minerals, which often also contain magnesium, are called ferromagnesian minerals; they include olivine, pyroxene, amphibole and biotite mica.
3.3 Lustre
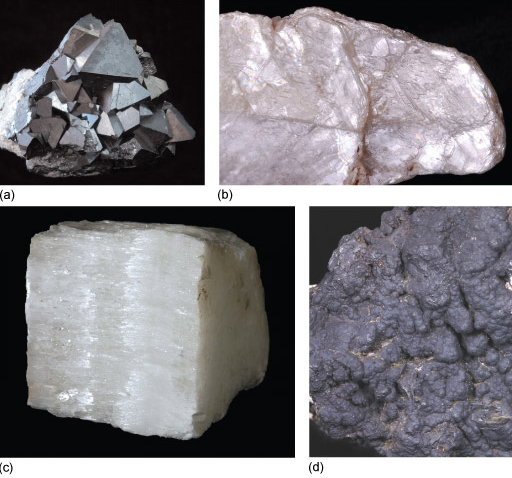
The term lustre refers to the surface appearance of a mineral, which depends on the way it reflects light. Quartz (Figure 5a) has a vitreous lustre, as do many other silicate minerals, such as feldspar. When transparent, like window glass or clear coloured glass, the term 'glassy' lustre may be used instead of vitreous: quartz, for example, often has a glassy lustre. Some opaque minerals scatter light very strongly, giving rise to shiny, reflective surfaces and a metallic lustre, such as seen in pyrite (Figure 5e) and magnetite (Figure 9a).
Other examples are pearly lustre (looking like pearls; Figure 9b), silky lustre (like shiny threads or fibres; Figure 9c), and a dull or earthy lustre (Figure 9d). Note that, as in the case of gypsum (Figures 9b and c), different varieties of the same mineral may show different types of lustre.
3.4 Cleavage
If a crystal is struck with a hammer, it will probably shatter into many pieces. Some minerals, such as calcite, break into well-defined blocky shapes with flat surfaces. These are called cleavage fragments (Figure 10b) and the flat surfaces are called cleavage planes (Figure 10a). Note that cleavage planes, which occur within a crystal, are not the same as crystal faces. Cleavage arises when the crystal structure contains repeated parallel planes of weakness (due to weak chemical bonds), along which the crystal will preferentially break.

The mineral mica (which includes biotite and muscovite) has such perfect cleavage in one direction that it can be readily split, or cleaved, into wafer-thin sheets, as shown in Video 2.
Some minerals break into irregular fragments that lack flat surfaces (except for any remnants of original crystal faces). In the case of quartz (Figure 11), which has no cleavage, the broken pieces have a curved pattern and this is called a conchoidal fracture ('conchoidal' is pronounced 'con-koi-dal').
Some minerals have only one set of cleavage planes, others have two sets, and a few (such as calcite) have three. In minerals with only one or two sets of cleavage planes, some broken surfaces will show just fracture.
Look at the video of the galena below. How many cleavage orientations does galena exhibit?
Download this video clip.Video player: Video 3Video 3 Rotating view of galena. (There is no sound in this video.)Interactive feature not available in single page view (see it in standard view).Galena has three sets of cleavage planes at right angles to each other.
3.5 Density
Density is a measure of how heavy an object is for a given volume. You can get a general idea of the relative densities of different minerals just by picking them up: a piece of galena (PbS) feels heavier than a piece of quartz (SiO2) of the same size.
The density of a mineral depends on its chemical composition, the type of bonding and its crystal structure. The standard unit of density is kg m−3. Examples of the relative densities of various minerals compared with water at room temperature (about 1000 kg m−3) are shown in Table 1. The relationship between density and crystal structure is explored further in Section 4.
| Mineral | Symbol/formula | Relative density at room conditions (compared with water = 1.0) |
|---|---|---|
| Graphite | C | 2.2 |
| Quartz | SiO2 | 2.65 |
| Diamond | C | 3.5 |
| Barite | BaSO4 | 4.5 |
| Galena | PbS | 7.6 |
| Silver | Ag | 10.5 |
| Gold | Au | 19.3 |
According to the information provided in the Digital Geology Kit, which of the following minerals has the highest density and which has the lowest density: garnet, gypsum and quartz?
Garnet has the highest density (3.6-4.3); gypsum has the lowest density (2.3). Quartz is in between (2.65). (Density values quoted are relative to water.)
3.6 Hardness
Hardness is loosely defined as the resistance of a material to scratching or indentation. The absolute hardness of a material can be determined precisely, using a mechanical instrument to measure the indentation of a special probe into a crystal surface. However, you can get a general idea of a mineral's relative hardness by undertaking a few simple scratch tests.
The nineteenth-century German mineralogist, Friedrich Mohs, devised a useful scale of mineral hardnesses, consisting of well-known minerals ranked in order of increasing hardness, from talc, with a hardness of 1, to diamond, with a hardness of 10 (Table 2).
| Mohs' hardness | Reference mineral | Non-mineral example (hardness in brackets) |
|---|---|---|
| 1 | talc | |
| 2 | gypsum | |
| fingernail (2.5) | ||
| 3 | calcite | |
| copper coin Footnotes 1 (3.5) | ||
| 4 | fluorite | |
| 5 | apatite | |
| window glass/ordinary knife blade (5.5) | ||
| 6 | orthoclase feldspar2 | |
| hardened steel (6.5) | ||
| 7 | quartz | |
| 8 | topaz | |
| 9 | corundum | |
| 10 | diamond |
Footnotes
Footnotes 1 Many of today's 'copper coins' are copper-plated steel and are harder below the copper coating. 2 Other types of feldspar may have a slightly greater hardness, between 6 and 6.5. Back to main textCompared with an absolute hardness scale, Mohs' scale is highly non-linear (diamond is about four times harder than corundum; Figures 12c and b) but, because the scale uses familiar minerals, it provides a quick and easy reference for geologists in the field.
Minerals with a hardness of less than 2.5 may be scratched by a fingernail (Video 4), whereas those with a hardness of less than 3.5 may be scratched by a copper coin (Video 5), and so on.
Will quartz scratch topaz (Figure 12a)?
The hardness of quartz is 7 whereas topaz has a hardness of 8, so topaz will scratch quartz, but not the other way round.
Using evidence from the Digital Geology Kit, which of the following minerals is the hardest, and which is the softest: galena, hematite, pyrite?
Pyrite is the hardest (6-6.5), galena the softest (2.5). Hematite has hardness 5-6.
Hardness should not be confused with toughness, which is the resistance of a material to breaking. Many minerals are hard, but they may not be tough. Diamond, for example, is the hardest known material, but it is not tough: it will shatter if dropped onto a hard surface.
4 The atomic structure of crystals
The atomic structure of a mineral influences many of its physical and optical properties. This section briefly considers some of the main ways in which atoms are arranged, and how they are bonded, starting with metals, which have some of the simplest atomic arrangements possible. Variations on these arrangements provide the structural foundations of many common minerals.
4.1 Metallic structures and bonding
Metal crystals are built from layers of densely packed metal cations (atoms that have lost one or more electrons, leaving them positively charged). The ions are organised in regular, close-packed arrangements.
In close-packing, a layer of identically sized atoms (or ions) occupies the minimum possible space - like a raft of hard spheres (e.g. marbles) in contact with each other. Each atom has six neighbours in a plane. The three-dimensional structure of a metal involves the successive stacking of close-packed layers on top of each other.
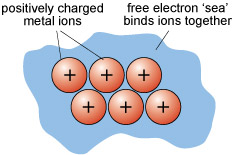
In metallic bonding, atoms donate one or more outer electrons to a free electron 'sea' (Figure 13), which flows between and around the cations and acts as a kind of glue, holding them together. This kind of bonding is uniform in all directions, so that metallic structures are dense and close-packed. The electron mobility renders metals both malleable and ductile, which are vital properties for producing thin sheets and for stretching out to form thin cables or filaments (e.g. copper wire).
4.2 Ionic structures and bonding
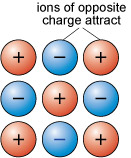
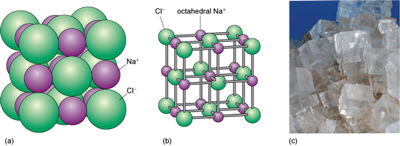
About 90 per cent of all minerals are essentially ionic compounds. Ionic bonding is generated by the transfer of one or more electrons from one atom to another. This creates two ions of opposite charge, which are attracted to each other (Figure 14). For example, in halite (sodium chloride, NaCl) there is a positively charged sodium cation, Na+, and a negatively charged chlorine anion, Cl−.
As with metallic bonding, ionic bonds are non-directional, so ionic crystals tend to have fairly dense, close-packed structures. However, ionic bonds tend to be stronger than metallic bonds, so crystals containing ionic bonds tend to be unmalleable and much more brittle than metal crystals.
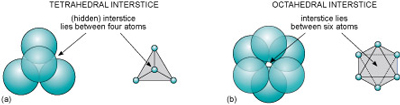
Even though a close-packed structure looks densely packed, there are actually lots of spaces between the atoms. These spaces are called interstices and are important in metallic structures because they provide sites for smaller atoms to reside. Interstices also provide a basis for many ionic structures: they provide locations for smaller ions, in the presence of large ions. There are two kinds of interstices:
- a tetrahedral interstice, surrounded by four atoms, one at each of the corners of an imaginary tetrahedron (Figure 15a)
- an octahedral interstice, surrounded by six atoms, arranged at the corners of an imaginary octahedron (Figure 15b).
The mineral halite (Figure 16) is an example of a structure with octahedral interstices (as in Figure 15b). The chlorine ions are arranged a bit like the atoms in a metal - although they do not quite touch each other. The sodium ions, which are much smaller, fit snugly between the large chlorine ions, as illustrated in a space-filling model (Figure 16a).
The structure of sphalerite (zinc sulfide, ZnS) (Figure 17) has a close-packed arrangement of sulfur ions, a structure in which zinc ions fill half of the tetrahedral interstices (as in Figure 15a).

4.3 Covalent structures and bonding
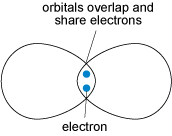
Covalent bonding is formed when two atoms share two electrons (one from each atom) through overlap and merging of two electron orbitals (Figure 18). Crystals containing covalent bonds tend to have more complex structures than those of ionic or metallic structures.
Covalent bonding requires the precise overlap of electron orbitals, so if an atom forms several covalent bonds, these are usually constrained to specific directions. As covalent bonds are directional, unlike metallic or ionic bonds, this places additional constraints on the arrangements of atoms within such a crystal. One result is that covalent structures tend to be more open, and hence have lower densities than do metallic or ionic structures.
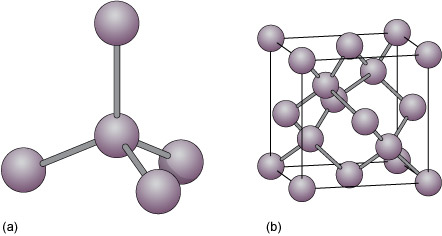
Diamond is an example of a covalently bonded solid. In this form of carbon, each atom is covalently bonded to four other carbon atoms, arranged at the corners of a tetrahedron (Figure 19a). The resulting structure, which has a repeating cubic shape, is illustrated in Figure 19b. The structure contains much more unoccupied space than do close-packed metal structures.
Another form of solid carbon with covalent bonding is graphite (Figure 20). Unlike those in diamond, the carbon atoms in graphite are covalently bonded to three neighbours in the same plane (Figure 20a), producing a strong sheet of carbon atoms. However, each carbon atom has one extra electron available for bonding that forms very weak bonds, which serve to keep the carbon sheets together (Figure 20b).
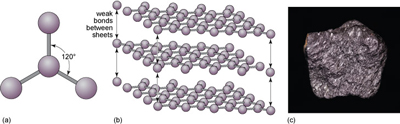
How do the crystal structures of diamond and graphite account for the differences in hardness between the two minerals?
Diamond has a three-dimensional bonding pattern, with identical bonding in all directions, and no 'weak' directions. Graphite has a mainly two-dimensional pattern, with sheets of C-C bonds. Bonds between the sheets are very weak, so sheets can easily slide past each other, explaining graphite's use as a lubricant and why it is soft enough to mark paper.
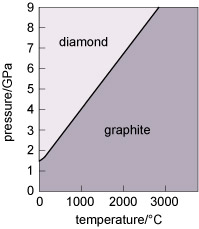
Diamond and graphite have the same chemical composition (pure carbon) but different crystal structures. They are known as polymorphs of carbon. Diamond is formed under higher pressures than graphite (Figure 21), and is less stable than graphite at the surface of the Earth. Indeed, temperature and pressure conditions within the Earth are such that diamond tends to form only at depths greater than 150 km. However, because of the strong bonding, it is very difficult to break down the diamond structure, so diamonds (fortunately) will not spontaneously transform into graphite! Note that not only is diamond harder than graphite, but it is also denser, as predicted by its structure (Table 3).
| Substance | Relative density at room conditions (compared with water = 1.0) | Structure and bonding |
|---|---|---|
| Ice, H2O | 0.9 | open structure; covalent bonds plus weak bonds between H2O molecules |
| Graphite, C | 2.2 | open structure; covalent bonds plus weak bonds between layers |
| Feldspar, KAlSi3O8 | 2.5 | open structure; predominantly covalent bonds |
| Quartz, SiO2 | 2.7 | open structure; predominantly covalent bonds |
| Olivine, Mg2SiO4−Fe2SiO4 | 3.2-4.4 | structure based on close-packing, but with ionic and covalent bonds; density increases as Fe content increases |
| Diamond, C | 3.5 | structure based on close-packing, but with covalent bonds |
| Barite, BaSO4 | 4.5 | ionic bonds between barium and sulfate groups |
| Hematite (iron oxide), Fe2O3 | 5.3 | structure based on close-packing; ionic and metallic bonds |
| Galena (lead sulfide), PbS | 7.6 | structure based on close-packing; ionic and metallic bonds |
| Silver, Ag | 10.5 | close-packed structure; metallic bonds |
| Gold, Au | 19.3 | close-packed structure; metallic bonds |
Minerals are never chemically pure; they always contain some foreign atoms. These impurity atoms may simply squeeze into the interstices. Another possibility is that certain elements may be able to directly replace (substitute for) the normal atoms in the ideal structure - although, for a comfortable fit, the substituting element must have a similar size and charge to the original atom. This phenomenon is called ionic substitution. An example is the substitution of Fe2+ for Mg2+, or Mg2+ for Fe2+, which occurs in the mineral olivine.
5 Crystal defects and twinning
Virtually all crystals contain minute imperfections or defects. The effect of defects on the physical and chemical properties of a crystal can be out of all proportion to their size.
Defects come in several types. Point defects may involve missing or displaced atoms in the crystal structure, giving empty sites, or vacancies. Such defects make it much easier for atoms to diffuse through the crystal structure by moving between vacant sites. This is important because the rate of diffusion of atoms through a crystal structure can determine the speed at which processes such as weathering, or other chemical reactions (e.g. during metamorphism) proceed.
Minerals in deformed rocks, such as those from mountain belts, contain large numbers of line defects caused by rows of atoms that are out of place in the crystal structure. Figure 22 shows an artificial example based on an alloy used in semiconductors, where each dark line represents a strained part of the crystal. Such defects affect the mechanical strength of a crystal, which determines the strength of rocks and how they deform under intense pressure. During deformation, progressive movement along flaws in crystals takes place in tiny steps, as bonds are broken and re-formed.
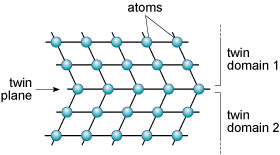
A third type of defect is called a planar defect. Crystals grow by the progressive addition of atoms onto a surface. 'Mistakes' in the stacking of new planes with respect to previously formed planes are common during crystal growth. These planar defects can have a profound effect on the way atoms are stacked, and can produce distinct regions called domains within a single crystal. One such planar defect is a boundary that separates two domains of a crystal that are mirror images (Figure 23). The result is called a twinned crystal.
Various types of crystal twinning exist, and in each case a single crystal consists of two or more regions with different orientations. The different regions of the twinned crystal may be related in various ways, such as by rotation about a symmetry axis (Section 6.2). Twinning is especially common in feldspar. Orthoclase feldspar often displays simple twinning, in which the crystal is divided into two domains with a different structural orientation (Figure 24).
Other types of feldspar (e.g. plagioclase feldspar) may have a more complex type of twinning, called multiple twinning, in which a single crystal has many different domains (Figure 25).
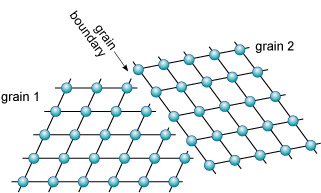
Grain boundaries are different from twin boundaries because there is no orientation relationship between crystals on either side of the grain boundary. There are two distinct grains, with the same, or a different, mineral composition (Figure 26).
6 Crystal symmetry and shape
In this section you investigate the relationship between the shape and symmetry of crystals, consider why minerals have only a limited number of crystal shapes, and discover how the shape of a mineral relates to its internal structure.
6.1 Crystal symmetry
When you first look at a collection of minerals in a museum, there may seem to be an infinite variety of crystal shapes. However, on closer inspection there is an underlying order, and this is best seen by the consistency in the angles between crystal faces for particular groups of minerals. Crystals possess a variety of symmetries, and it has been demonstrated by X-ray methods that symmetry visible in hand specimen relates to the internal arrangement of atoms.
Most people have an idea of what is meant by symmetry, as many everyday objects and living things possess it. There are two main types of symmetry:
- reflection symmetry, where one side of an object is the mirror image of the other side (e.g. insects, birds and spoons)
- rotational symmetry, where an object looks the same after a certain amount of rotation (e.g. many flowers, starfish and bicycle wheels).
Many complicated patterns such as carpet or wallpaper designs have symmetry, but these can sometimes be a little difficult to discern. Consider, therefore, an object with obvious symmetry, such as a snowflake (Figure 27).

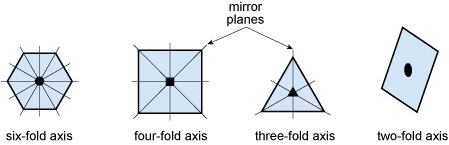
Each snowflake can be rotated by 60° about an axis perpendicular to the page and it will look exactly the same as it did before. The operation can be repeated six times in a full 360° rotation, and at each 60° interval the snowflake will look the same. Thus the snowflake has a six-fold rotational symmetry. A snowflake also possesses reflection symmetry: if you 'split' the snowflakes along certain planes, called mirror planes, the two halves are mirror images of each other.
Some examples of rotational and reflection symmetry found in crystals are illustrated in Figure 28. The first three shapes are bisected with examples of mirror planes to illustrate reflection symmetry. Placed at the centre of each shape is the appropriate symbol for their rotation axis.
6.2 Crystal lattices and unit cells
A typical crystal contains billions of atoms in a highly ordered structural arrangement. Perhaps, surprisingly, the essence of such a complex structure can be described relatively simply. How is this possible?
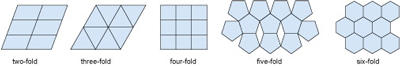
If you tried to tile a two-dimensional area such as a bathroom floor without any gaps, you would do this by adding tiles that fitted together. In fact, only tiles with two-, three- four- and six-fold symmetry allow for successful tiling (Figure 29). Similarly, if you tried to produce a three-dimensional structure (like a crystal) without any gaps it would require the repetition of building blocks (i.e. 3D repeating units) with particular shapes. As with two-dimensional tiling, the only kinds of rotational symmetry axis possible in three-dimensional crystals are two-, three-, four- and six-fold axes.
A lattice is an array of objects or points that form a periodically repeating pattern in two or three dimensions. In a crystal lattice, the repeating pattern is simply an arrangement of atoms (or ions) that is located at regular points, called lattice points.
Figure 30a shows a three-dimensional lattice, the building of which can be envisaged by simply stacking a series of identical two-dimensional lattices on top of each other. A crystal is, in effect, a structure formed by countless numbers of identical tiny building blocks, called unit cells (Figure 30b), and these make up the crystal lattice. Each mineral has a specific unit cell, which is defined according to the lengths of its sides and their angular relationships. Each unit cell contains one or more different kinds of atoms joined to each other by chemical bonds. Shapes of unit cells vary from one mineral to another; all have six sides (three sets of parallel faces, though not necessarily perpendicular to each other).
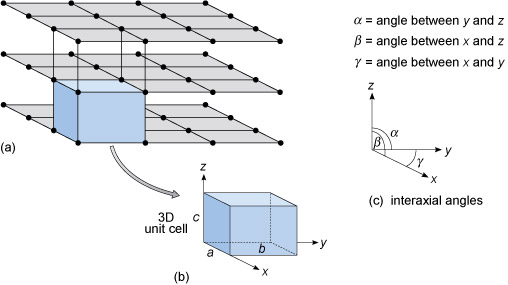
To define the resulting 3D lattice, it is convenient to specify reference directions, x, y and z, which are chosen to be parallel to three edges of the unit cell (Figure 30b). These are known as crystallographic axes, and it is important to remember that they are not always at 90° to each other. The angles between the axes are denoted by the Greek letters α, β and γ (alpha, beta and gamma), as shown in Figure 30c. The size of the unit cell is given by the lengths of the three edges, a, b and c, as shown in Figure 30b.
The unit cell is extremely small - typically less than 1 nm (10−9 m) in any direction. It is therefore a huge jump in scale from a single unit cell to a single crystal visible to the naked eye. With an edge length of 1 nm, a crystal only 1 mm3 requires 1018 unit cells to build it: a vast number.
So a three-dimensional lattice (which may have billions of lattice points) can be represented by just six numbers: the lattice parameters a, b, c, α, β and γ. In the next section you will see how the shape of the unit cell relates to a crystal's symmetry, and what this means for the external shapes of crystals.
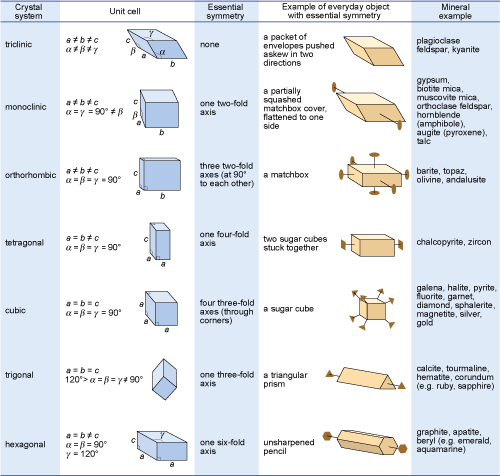
6.3 Crystal systems
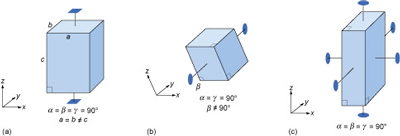
Most three-dimensional lattices display some symmetry, although the symmetry elements (e.g. rotation axes and mirror planes) can be in any direction. Some arrangements of symmetry elements place special constraints on the shape of the unit cell. For example, a four-fold rotation axis requires the unit cell to have a square section at right angles to the symmetry axis (Figure 31a). Three four-fold axes at right angles to each other imply that the unit cell must be a cube, and so on.
Crystals are classified on the basis of this three-dimensional symmetry (and hence the shapes of their unit cells) into one of seven different crystal systems (Figure 32).
Study the three unit cell shapes shown in Figure 31. To which of the seven crystal systems would each belong?
Figure 31a: tetragonal; Figure 31b: monoclinic (note that while two axes are at 90° to each other, one axis is inclined - hence the term 'monoclinic'); Figure 31c: orthorhombic. See Figure 32.
What would be the shape of the cross-section, at right angles to the longest side, of a crystal with a unit cell like that in Figure 31a?
The cross-section would be square.
The beauty of crystallography is that you do not need to see the lattice, the unit cell, or the atoms in order to deduce this symmetry. The extent of symmetry varies from the cubic system, which has the most symmetry, to triclinic, which has the least.
Generally, the more symmetry a crystal has, the more constraints this places on its external shape. Crystals belonging to the cubic system tend to have equidimensional shapes, such as cubes, octahedra (with eight faces), or rather rounded-looking crystals with many faces (e.g. dodecahedra, with 12 faces). Pyrite and galena, for example, can have very simple cube-shaped crystals, which clearly indicate their underlying cubic symmetry. These same minerals may also have more complex shapes, with many more faces, but each shape still has the symmetry that places the mineral within the cubic system.
The same possibility for variation within certain limits applies to other minerals in different crystal systems. Despite their complexity, by focusing on the symmetry relationships between faces, you may still be able to determine the crystal system.
Sometimes a crystal has less symmetry than first appearance suggests. For example, quartz crystals are usually prismatic, and often have a hexagonal appearance in cross-section. At first, quartz thus appears to have a six-fold rotation axis. However, in some well-developed quartz crystals there are a number of small faces that present the same appearance only three times in a full 360° rotation, revealing that the true symmetry is less.
Given this information, to which crystal system does quartz belong?
The trigonal system (Figure 32), as this is the only system in which only one three-fold axis is present.
It is important to realise that conditions during the growth of a crystal often prevent some faces from developing as perfectly as they might, which results in individual crystal faces having different sizes. Some crystal faces may not be developed at all. Therefore, when looking at crystal symmetry, the angles between faces should be considered (Figure 33), not the absolute sizes of individual faces.
Conclusion
This free course provides the necessary background to enable you to progress with further study of the main mineral groups and the identification of minerals and rocks in this section using the Digital Kit. It has addressed the following points.
- Matter exists in the form of gases, liquids and solids, and the arrangement of atoms becomes progressively more ordered from gases to solids. The stability fields for the three states of a chemical element or compound are shown in a pressure-temperature plot known as a phase diagram.
- Physical characteristics of minerals evident in hand specimen include crystal shape, colour, lustre, cleavage, density and hardness. Colour may be misleading, as minute amounts of impurities can affect the colour of some minerals. Cleavage, density and hardness are strongly related to the underlying atomic structure.
- Atoms are bonded together by three different mechanisms: metallic bonding, in which a 'sea' of electrons holds the metal cations strongly together, giving dense, closely packed structures; ionic bonding, where electrons are transferred between atoms, producing positive and negative ions that are strongly attracted to each other; and covalent bonding, where electrons are shared, resulting in open, low-density crystal structures, which are strongly bonded. About 90 per cent of all minerals are essentially ionic compounds.
- Crystals may have several different types of defect that can strongly influence the mineral's physical and chemical properties.
- Many geological processes - rock formation, rock deformation, weathering and metamorphism - are controlled by processes operating at very small scales, such as the movement of atoms in crystals (diffusion), the breaking of atomic bonds within crystal structures, the initiation and growth of new crystals, and phase transformations.
- Various types of crystal twinning exist. In each case, the twin is a single crystal that consists of two or more regions in which the crystal lattice is differently orientated.
- The external shape of a crystal (i.e. the arrangement of crystal faces) is controlled by its internal structure. Crystals are composed of atoms arranged in repeating patterns that can have two-, three-, four- or six-fold symmetry. Each repeating pattern is located at a lattice point. A three-dimensional crystal lattice is a structure formed by countless numbers of identical, tiny building blocks, called unit cells. Unit cells have a box shape, which can be defined by the length of the three sides of the unit cell (a, b and c) and the angle between the axes of the unit cell (α, β and γ). Variation in the shape of the unit cell results in different symmetry elements (rotation axes and reflection planes), but all crystals may be ascribed to one of seven crystal systems.
- When looking at crystal symmetry, the angles between faces are more important to consider than the absolute sizes of individual faces, as conditions during the growth of a crystal often prevent some faces from developing as perfectly as they might, or from developing at all.
Glossary
- acicular
- Needle-shaped.
- anion
- An atom (or group of atoms) that carries a negative charge.
- amorphous
- A description of a substance that is without shape; a material that is structurally disordered, e.g. glass.
- cations
- An atom (or group of atoms) that has lost one or more electrons, to give it a positive charge.
- cleavage
- Planes of weakness in the crystal structure of a mineral allowing it to fracture along smooth parallel surfaces (cleavage planes). Also planes of weakness in metamorphic rocks, notably slates, caused by the alignment of fine-grained, platy materials. See also slaty cleavage.
- cleavage fragments
- Broken piece of a crystal with a well-defined, blocky shape and a flat surface.
- cleavage planes
- A term used in minerals for flat surfaces formed along planes of structural weakness when a crystal is broken. A term used in rocks for a plane along which platy minerals are aligned and splitting tends to occur; most well-developed in slates.
- conchoidal fracture
- A curved (shell-like) pattern developed on the fractured surface of fine-grained and glassy rocks and some minerals (such as quartz) that lack cleavage. (Pronounced 'con-koi-dal'.)
- covalent bonding
- A type of bonding in a mineral structure in which most, or all, of the chemical bonds between atoms involve sharing of electrons.
- crystal systems
- The classification scheme for crystals, based on symmetry elements.
- crystalline
- A term used to describe solid material composed of crystals, formed when atoms are arranged in a structurally ordered pattern, as occurs when a liquid cools more slowly. Also used to describe the rock texture when crystals have grown together to form an interlocking mass, as occurs in crystallisation from liquid (igneous crystallisation) and solid (metamorphic crystallisation) states.
- crystallographic axes
- A set of three directions in a crystal (labelled x, y and z) that are parallel to the edges of a unit cell.
- dendritic
- Descriptive term for a mineral with clusters of crystals in fern-like branches.
- density
- A measure of how heavy an object is for a given volume.
- devitrification
- The slow transformation of glass to a crystalline form.
- equidimensional
- Term used to describe a crystal that has a rather similar appearance in different directions.
- ferromagnesian minerals
- Silicate minerals rich in iron and magnesium, including olivine, pyroxene, amphibole and biotite mica. See also mafic minerals.
- glass
- A structurally disordered solid formed by quenching of a liquid.
- globular
- Descriptive term for a mineral with acicular (needle-like) crystals radiating in all directions from a central point to forma a spherical aggregate.
- goniometer
- Device for measuring the angle between crystal faces.
- grain boundary
- The line of contact between adjacent crystals in a rock.
- graphite
- A polymorph of carbon that consists of sheets of atoms tightly bonded in a hexagonal structure with only weak bonds between sheets. It is stable at low temperatures and pressures.
- halite
- A mineral form of sodium chloride (NaCl), also known as rock salt. It is an example of purely ionic bonding between Na+ cations and Cl− anions.
- hardness
- The resistance of a material to scratching or indentation.
- interstices
- The spaces in a close-packed crystal structure that can accommodate small atoms or ions.
- ionic bonding
- A type of bonding in a mineral structure, generated by the transfer of one or more electrons from one atom to another, creating two ions of opposite charge which are attracted to each other.
- ionic substitution
- The replacement of ions of one element by those of another in a crystal structure. Ions most likely to substitute for one another have similar sizes and electrical charges.
- lattice
- An array of objects or points in space that form a repeating pattern in two or three dimensions.
- lustre
- The surface appearance of a mineral that depends on the way it reflects light. Typical terms used to describe a mineral's lustre include: glassy, resinous, metallic.
- massive
- Descriptive term for crystals that have grown together in a solid mass, in which individual crystals cannot clearly be seen.
- metallic bonding
- A type of bonding in a mineral structure involving atoms donating one or more electrons to a 'sea' of free electrons that flows between and around the cations. Such structures are dense and close-packed, yet malleable and ductile.
- mirror planes
- A plane of symmetry, dividing two halves of an object that are mirror images of each other.
- Mohs' scale
- A scale of mineral hardness devised by Friedrich Mohs and consisting of ten well-known minerals, ranked in order of hardness from the softest, talc (hardness 1) to the hardest, diamond (hardness 10).
- phase boundary
- The dividing line between two stability fields on a phase diagram.
- phase diagram
- A diagram showing the stability fields over which different phases of matter can exist (at equilibrium) and the phase boundaries between them. Usually, such a diagram is plotted for a fixed chemical composition over a range of pressure and temperature, in which case the axes of the graph represent pressure and temperature.
- phase transformation
- An event involving the conversion of one phase into another phase having the same chemical composition (but with a different crystal structure, if any).
- phases
- The state in which a particular substance can exist - as gas, liquid or solid. Also used to refer to a mineral with a definite chemical composition.
- polymorphs
- Substances that have the same chemical composition, but different crystal structures. For example, diamond and graphite are both polymorphs of carbon.
- prismatic
- Term used to describe a crystal stretched out in one direction.
- reflection symmetry
- The property where one side of an object is a mirror image of the other (e.g. insects, birds).
- rotational symmetry
- The property of an object that produces an identical arrangement of crystal faces at regular intervals of rotation.
- sphalerite
- A mineral form of zinc sulfide, ZnS.
- stability field
- The range of temperatures and pressures over which a particular phase or phase assemblage is stable.
- tabular
- Term used to describe a slab-like or platy crystal.
- toughness
- Term used to describe the resistance of a material to breaking or shattering.
- triple point
- The point of intersection of three phase boundaries on a phase diagram representing the pressure and temperature conditions at which solid, liquid and gas phases can coexist.
- twinning
- The term used to describe a type of crystalline defect, in which a crystal contains different regions in which crystal lattices are related in a predictable way (e.g. by reflection in a mirror plane, or rotation about a symmetry axis).
- unit cells
- The basic building block of a 3-dimensional crystal lattice with three sets of parallel sides and a lattice point at every corner.
Acknowledgements
This course was written by Glynda Easterbrook.
Except for third-party materials and otherwise stated in the acknowledgements section, this content is made available under a Creative Commons Attribution-NonCommercial-ShareAlike 4.0 Licence.
Course image: Macroscopic Solutions in Flickr made available under Creative Commons Attribution-NonCommercial-ShareAlike 2.0 Licence.
The material acknowledged below is Proprietary and used under licence (not subject to Creative Commons Licence). Grateful acknowledgement is made to the following sources for permission to reproduce material in this course:
Peter Sheldon
Figure 1: Peter Sheldon
Figure 2: Peter Sheldon
Figure 5a, b, c, d, e: Photograph by Andy Tindle © The Open University
Figure 7a, b, c: Photograph by Andy Tindle © The Open University
Figure 8: Photograph by Andy Tindle © The Open University
Figure 9a, b, c, d: Photograph by Andy Tindle © The Open University
Figure 10a: Photograph by Andy Tindle © The Open University
Figure 10b: Peter Sheldon
Figure 11: Photograph by Andy Tindle © The Open University
Figure 12a, b: Photograph by Andy Tindle © The Open University
Figure 12c: Joel Arem/Science Photo Library
Figure 16c: Photograph by Andy Tindle © The Open University
Figure 17c: Photograph by Andy Tindle © The Open University
Figure 20c: Photograph by Andy Tindle © The Open University
Figure 22: Dr Naomi Williams
Figure 24b: Photograph by Andy Tindle © The Open University
All videos © The Open University
Every effort has been made to contact copyright owners. If any have been inadvertently overlooked, the publishers will be pleased to make the necessary arrangements at the first opportunity.
1. Join over 200 000 students currently studying with The Open University - http://www.open.ac.uk/ choose/ ou/ open-content
2. Enjoyed this? Find out more about this topic or browse all our free course materials on OpenLearn - http://www.open.edu/ openlearn/
3. Outside the UK? We have students in over a hundred countries studying online qualifications - http://www.openuniversity.edu/ - including an MBA at our triple accredited Business School.
Don't miss out:
If reading this text has inspired you to learn more, you may be interested in joining the millions of people who discover our free learning resources and qualifications by visiting The Open University - www.open.edu/ openlearn/ free-courses